Bitcoin Rebounds, ETFs Lose $679M — October 12, 2026
Bitcoin rebounds to $84,192, but a $678.9 million week of ETF outflows leaves the recovery waiting for stronger demand and a reclaim of $85,500.

Bitcoin is back above $84,000, but US spot Bitcoin ETFs just finished a week with $678.9 million in net outflows. The price bounce is real; the evidence that institutional demand has repaired itself is thinner. If you are treating Monday’s green screen as a breakout, the next test is whether buyers can reclaim lost levels while the ETF channel starts contributing again.
Research cutoff: October 12, 2026, 07:03:01 UTC. Binance spot tickers were retrieved at approximately 07:01:04 UTC. Their exchange-reported rolling windows run from October 11 around 07:01:06 UTC to October 12 around 07:01:06 UTC; minor differences reflect the exchange clock and separate requests. Prices are quoted in USDT, not a guaranteed equivalent amount of US dollars.
Linked market pages show current data; this article records the historical snapshot collected at the cutoff. ETF figures refer to dated US trading sessions. Earlier on-chain and order-book observations retain their original dates rather than being presented as today’s live positions.
What is Bitcoin doing on October 12?
Binance BTC/USDT traded at 84,192.00 USDT, up 1.228% over its rolling 24-hour window. The session high was 84,352.00 and the low was 82,975.37. That is a 1,376.63 USDT range, with the latest price only 160 USDT below its upper edge.
The official Binance market overview provides a readable place to follow the market. Its broad asset-volume display should not be confused with the single-pair volumes used here.
| Binance spot pair | Snapshot price, USDT | Rolling 24h change | Rolling 24h quote volume |
|---|---|---|---|
| BTC/USDT | 84,192.00 | +1.228% | 715.08 million USDT |
| ETH/USDT | 2,570.69 | +2.564% | 548.71 million USDT |
| SOL/USDT | 112.65 | +2.558% | 152.90 million USDT |
| BNB/USDT | 755.11 | +0.852% | 54.81 million USDT |
The table captures a broad rebound among these four pairs. ETH and SOL gained roughly twice as much as BTC in percentage terms, while BNB lagged. Those are relative returns over one rolling window, not proof that capital has permanently rotated into altcoins.
Bitcoin’s location within the range is encouraging for the immediate tape. Buyers have recovered most of the distance from the low to the high. But reaching the upper end of a recent range and escaping a larger trading range are different achievements. A market can look strong on a daily percentage display while remaining below levels it lost last week.
The cleanest interpretation is a recovery attempt. Calling it a confirmed trend change requires evidence that this snapshot cannot supply: repeated closes above resistance, stronger participation and a demand channel that persists beyond a quiet weekend.
Why does the $678.9 million ETF loss matter?
The October 5–9 ETF total is negative despite Friday’s small inflow. The daily totals below come from Farside Investors’ Bitcoin ETF table. Parentheses in the source indicate outflows; these rows displayed numeric entries across the fund columns at retrieval.
| US trading session | Net Bitcoin ETF flow, US$ million |
|---|---|
| October 5 | -89.8 |
| October 6 | +118.8 |
| October 7 | -484.9 |
| October 8 | -244.1 |
| October 9 | +21.1 |
| Five-session total, calculated | -678.9 |
Wednesday and Thursday account for $729.0 million of combined outflows. Friday’s $21.1 million inflow offsets only about 2.9% of that two-day loss. No October 12 session total was available at the cutoff; that is unavailable data, not a zero-flow reading.
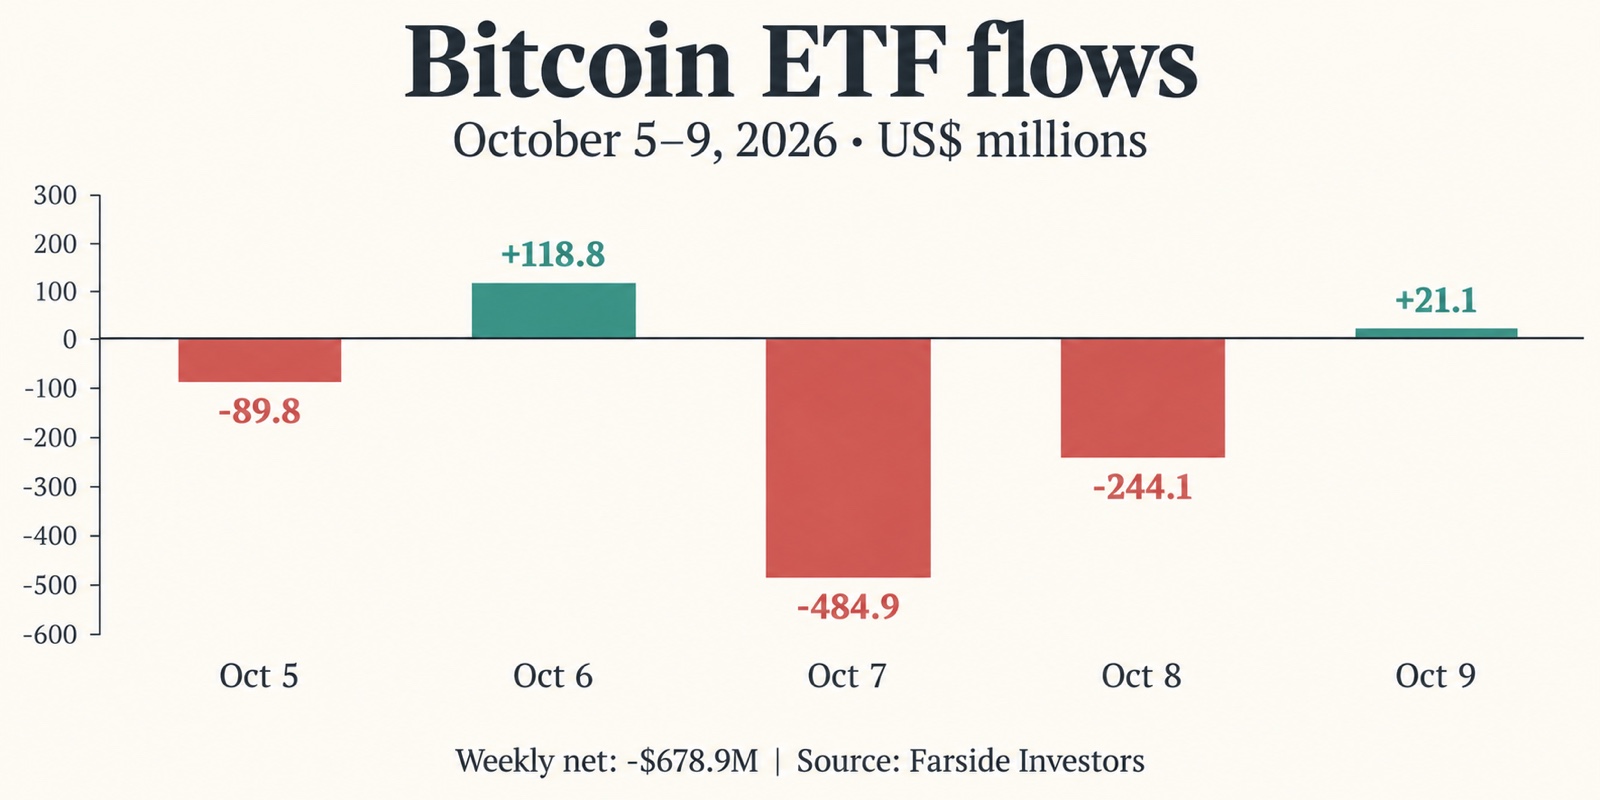
AI-generated infographic using the dated Farside figures in the table; the table is the numerical reference.
The analytical point is about persistence. One positive session can show that selling pressure has eased without establishing that a reliable new buyer has returned. A more useful follow-up is whether several subsequent sessions accumulate meaningful net subscriptions, especially if price is also trying to clear overhead resistance.
ETF flows and exchange trading volumes measure different things. Net creations and redemptions are not the same as gross turnover, and a weekly dollar flow cannot be divided into one exchange’s rolling daily volume to produce a market-wide demand ratio. They also do not identify every buyer or seller behind Bitcoin’s price move.
The rebound can therefore continue while ETF demand is weak. Other participants can buy, shorts can cover, and available sell liquidity can shrink. The risk is that a rally supported by those forces has less room for disappointment if a large source of incremental demand stays absent.
What would make the recovery more convincing?
Holding above the snapshot high would be a first checkpoint; reclaiming $85,500 would be a stronger test. The latter comes from Glassnode’s October 7 market report, which described weak participation and a failed push through earlier supply.
That report put combined spot-exchange and US ETF volume near $6.8 billion a day on a seven-day average. It also described short-term holders taking profits into the October 4 close. Those are earlier observations, not October 12 measurements.
Its October 7 Binance order-book analysis located asks around $86,500–$86,750 and larger bids around $81,000–$81,250. Orders can be filled or withdrawn. These are historical reference zones requiring a fresh check, not promises that the same liquidity is waiting today.
| Checkpoint, approximately USD/USDT | Evidence and date | Interpretation |
|---|---|---|
| 82,975.37 | BTC/USDT rolling 24h low, October 12 snapshot | Immediate range floor; a break would erase more of the rebound |
| 84,352.00 | BTC/USDT rolling 24h high, October 12 snapshot | First fresh test of whether buyers can extend the recovery |
| 85,500 | Glassnode reclaim reference, October 7 | Earlier lost level; renewed acceptance would strengthen the setup |
| 86,500–86,750 | Glassnode Binance asks, October 7 | Earlier supply zone; verify the current book before relying on it |
| 81,000–81,250 | Glassnode Binance bids, October 7 | Earlier downside liquidity reference, not guaranteed support |
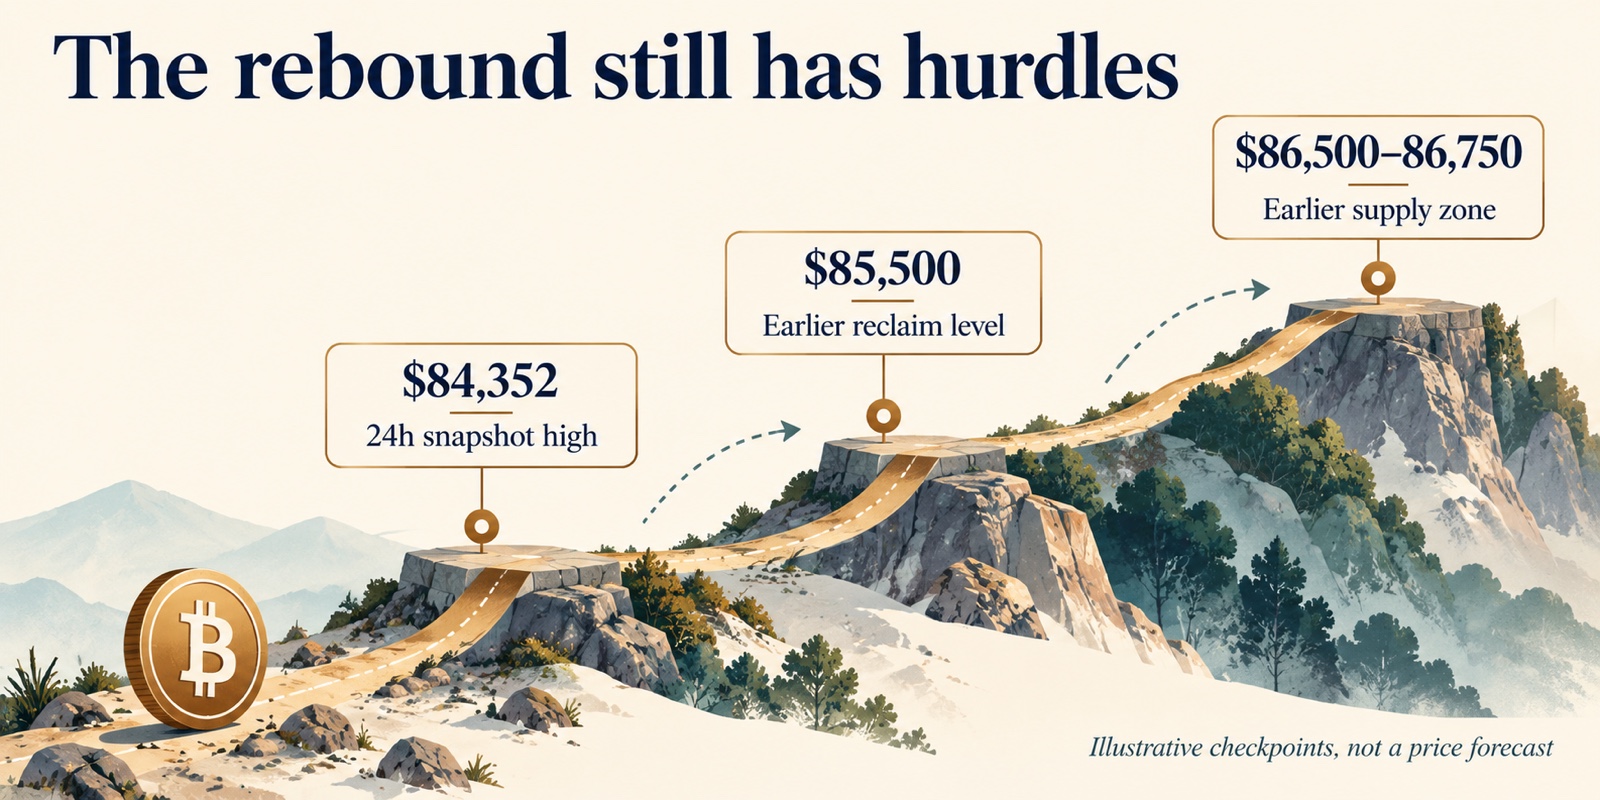
AI-generated checkpoint illustration. The first level comes from this article’s ticker snapshot; the higher references come from the earlier Glassnode report. This is not a price forecast.
From 84,192, a move to 85,500 is about 1.55%. The bottom of the earlier supply zone is about 2.74% away. These calculated distances explain why a respectable daily rebound still leaves Bitcoin with work to do.
For a breakout assessment, look for acceptance rather than a brief touch. A price spike through a level followed by an immediate reversal carries a different message from sustained trading above it. The same applies to the downside: a fleeting print below a reference zone and a decisive loss of that zone should not be treated identically.
Volume deserves context too. Today’s 715.08 million USDT is BTC/USDT turnover on Binance over a rolling window. It cannot be directly compared with Glassnode’s multi-venue, ETF-inclusive seven-day average as though they were one consistent series. A useful participation comparison needs the same venue, instrument and sampling window across sessions.
Follow the setup with a defined execution plan
A watchlist is more useful than an improvised trade. Decide which level would invalidate your view, how much loss you can tolerate and whether the likely spread and fees justify the position before placing an order.
If you choose Binance and it is available in your jurisdiction, the signup link below pre-applies RATE20. Check the displayed referral benefit and account eligibility before registering.
Sign up on Binance with the RATE20 fee-discount offer →
RATE20 is offered for a 20% trading-fee discount; verify the terms shown during registration. SmallDrift may earn a referral commission. A lower fee does not make an uncertain market setup less uncertain.
Why are altcoins bouncing faster than Bitcoin?
ETH and SOL outperformed BTC in this snapshot, but four pairs are too narrow a sample to declare an altcoin season. ETH’s gain exceeds Bitcoin’s by 1.336 percentage points; SOL’s exceeds it by 1.330 points. BNB trails Bitcoin by 0.376 points.
That dispersion matters more than the simple observation that every row is green. A uniform surge would suggest a different market character from a selective rebound led by particular assets. Neither observation alone establishes the underlying cause.
A higher daily return can also reflect a recovery from a larger previous decline. Without a consistent earlier comparison period, it would be misleading to say these gains have repaired last week’s losses. This article does not manufacture a missing weekly return series to complete that story.
The CoinGecko global market charts offer a wider view. Its separately retrieved global API snapshot reported $2.839 trillion in total market capitalization, $62.00 billion in aggregate 24-hour volume and 59.57% Bitcoin dominance. The API’s total-market-cap change was -2.190% over 24 hours.
The public page returned a different reading during research. These displays were not synchronized, so the API figures above are explicitly the saved snapshot rather than numbers copied from the live page. Nor should the API’s aggregate decline be treated as a precise contradiction of the four Binance pair gains: coverage, valuation inputs and update times differ.
For a broader recovery, the next useful evidence would be more assets participating over a consistent window. Until then, today’s relative strength is a clue to monitor, not a durable allocation rule.
Binance updates: separate product news from demand
The official Binance announcement page displayed updates covering the STG-to-ZRO token merge, HYPE product availability and bStocks dividend distribution. These are the items visible at retrieval; the listing alone does not establish that each was published on October 12.
Product access can matter for individual assets, but none of those headlines proves that Bitcoin’s institutional demand has improved. The relevant checks differ: token conversions and supported services affect operational decisions, while ETF flows and consistent spot-market participation help assess the BTC recovery.
This distinction prevents a common reading error. An exchange can expand its product menu while the broader market remains cautious. More things to trade does not automatically mean more capital has arrived to trade them.
Keep fee savings in proportion
Fees are a controllable part of execution, but they should stay subordinate to position sizing and price risk. If an eligible account receives a 20% referral benefit, the benefit applies to the relevant fee under the displayed terms, not to the value of the trade itself.
For illustration only, a 0.10% starting spot fee reduced by 20% becomes 0.08%. If a separate eligible 25% BNB deduction also applies multiplicatively, the arithmetic is 0.10% × 0.80 × 0.75 = 0.06%. That is a conditional example, not a verified fee quote for every account, region or product. Maker pricing also depends on the fee schedule; a limit order that executes immediately can still be a taker order.
For signup details, see Get 20% off with code RATE20, then check the actual terms presented to you.
Create your Binance account with the RATE20 offer →
Referral code: RATE20, pre-applied by the signup link. Review the displayed discount before completing registration.
Frequently asked questions
What is Bitcoin’s price on October 12, 2026?
The saved Binance BTC/USDT snapshot was 84,192.00 USDT, up 1.228% over its rolling 24-hour window. It was retrieved around 07:01 UTC. Live market pages will show later prices, and other venues may differ.
Did Bitcoin ETFs have inflows or outflows last week?
Farside’s October 5–9 daily totals sum to $678.9 million in net outflows. Friday was positive, but that small inflow did not reverse the weekly result. No October 12 session total was available at the research cutoff.
What Bitcoin levels matter after the rebound?
The fresh snapshot high at 84,352 USDT is the nearest upside checkpoint, followed by the earlier $85,500 reclaim reference. The rolling low was 82,975.37 USDT. Higher supply and lower bid zones from October 7 remain historical context and need current confirmation.
The practical question for the next sessions is whether price strength and sustained demand start moving together. Bitcoin has recovered ground. The ETF ledger still asks buyers to show their receipts.
This article is for informational purposes only and does not constitute financial advice. Always do your own research before making investment decisions.
Get 20% Off Binance Trading Fees with RATE20
New to Binance? Open the official signup page with RATE20 already applied for a 20% trading-fee discount. You do not need to copy or type the code. Review the referral details before completing registration.

- Referral code: RATE20, pre-applied by this link
- Fee discount: 20%, shown on the Binance signup screen
- Additional rewards: Check Binance for current promotions and regional availability
Be wary of unofficial referral offers promising benefits they cannot show. The Binance signup screen lets you check the code and fee discount directly.
Compare Binance fees and available discounts →
SmallDrift may earn a commission when you sign up through this link. Trading involves risk, including loss of capital.
Related Articles


Explore Related Guides
Daily Crypto Market News
Follow Bitcoin price moves, major altcoins, and the events shaping the market.
Bitcoin ETF Flows Guide
Understand ETF inflows and outflows, and how to read them alongside price action.
Binance Fee Calculator
Learn how to estimate trading costs with referral and BNB discounts.
Verified Binance Referral Guide
See how RATE20 is applied and what to check on the Binance signup screen.