October 7, 2026: Bitcoin at $84,226—Where Is the ETF Bid?
Bitcoin slips below $85,000 despite renewed ETF inflows. A dated market snapshot separates short-term demand from bullish custody narratives.

Bitcoin fell to 84,226 USDT even after US spot ETFs recorded another positive session. The institutional bid returned, but the price snapshot still shows sellers winning the rolling day. For anyone watching the $85,000 area, the question is whether fresh buying can absorb supply—or whether a good headline is doing more work than the actual orders.
Research cutoff: October 7, 2026, at 07:02:15 UTC. Binance prices below were retrieved around 07:00:45–07:00:46 UTC; each change refers to that pair’s rolling 24-hour window, not a UTC calendar day. CoinGecko is a separately updated aggregate. Linked market pages show current data, while the figures in this article are a preserved historical snapshot. ETF figures cover completed US trading dates through October 6, as displayed at research time, and may be revised.
What is Bitcoin’s price today?
At the captured Binance BTC/USDT snapshot, Bitcoin traded at 84,226.01 USDT, down 1.236% over the rolling 24 hours. Its high was 86,698.99 and its low was 83,577.00. Those observations establish the immediate range; they do not establish where Bitcoin must go next.
The official Binance BTC/USDT market page lets readers monitor the pair. USDT is the quote asset here. Dollar shorthand in the headline is for readability, not a claim that every Bitcoin venue prints precisely the same USD price.
| BTC/USDT measure | Captured value | Interpretation |
|---|---|---|
| Last traded price | 84,226.01 USDT | Snapshot, not a closing price |
| Rolling 24-hour change | −1.236% | Relative to the ticker window’s opening price |
| Rolling 24-hour open | 85,280.01 USDT | Starting reference for this particular window |
| Rolling 24-hour high | 86,698.99 USDT | Observed upper extreme |
| Rolling 24-hour low | 83,577.00 USDT | Observed lower extreme |
| BTC volume | 15,877.65 BTC | Binance spot pair only |
| Quote volume | 1.355 billion USDT | Turnover, not net capital inflow |
The BTC ticker window ran from October 6 at 07:00:45.003 UTC to October 7 at 07:00:45.003 UTC. Its last price was roughly 0.78% above the low and 2.85% below the high. That places Bitcoin nearer the bottom of the observed range, despite the positive ETF headline.
This is the first distinction worth keeping: turnover and buying pressure are different things. Every executed trade has a buyer and seller. A billion dollars of exchange volume can accompany distribution just as easily as accumulation. Without a comparable historical series, calling this turnover unusually strong or weak would add confidence that the evidence does not support.
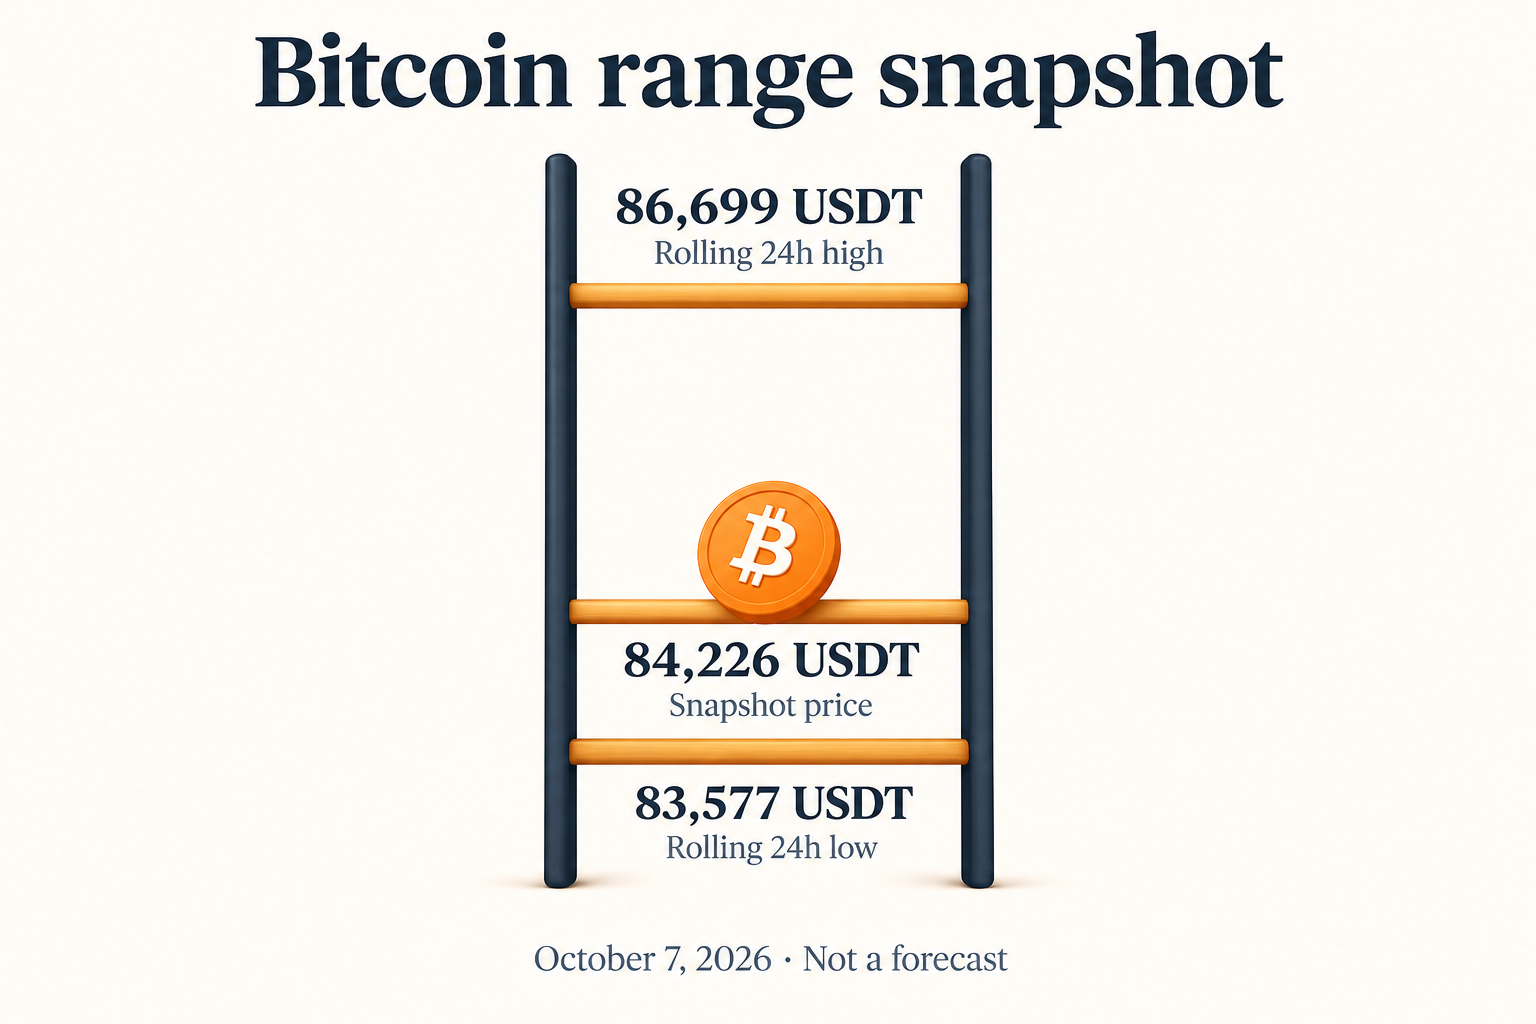
AI-generated educational illustration using rounded snapshot values; it is not a price forecast or a historical time-series chart.
ETF buying returned. Did it change the demand picture?
October 6 brought $118.8 million of net US spot Bitcoin ETF inflows, according to the captured Farside table. The preceding session showed $89.8 million of outflows, leaving a calculated two-session balance of positive $29.0 million.
The latest rows in Farside’s Bitcoin ETF flow table also show that October 6’s buying was concentrated: IBIT received $122.0 million, MSBT received $7.8 million, and the Grayscale BTC fund lost $11.0 million. Other listed funds showed zero in that row. On October 5, IBIT’s buying had been outweighed by redemptions elsewhere.
| Completed US trading date | Net ETF flow | Reading |
|---|---|---|
| October 5, 2026 | −$89.8 million | Net redemptions |
| October 6, 2026 | +$118.8 million | Net creations returned |
| Two-session sum, calculated | +$29.0 million | A modest positive balance |
That is a reversal in daily direction, not proof of a sustained buying campaign. There was no October 7 US-session flow total in the captured table. Filling that blank with an estimate would turn a report into a prediction.
ETF flows and Bitcoin’s rolling-day price also use different clocks. Fund creations and redemptions reflect the US trading session and reporting process; Binance trades continuously. These figures can inform the same analysis without being synchronized enough to prove that one particular flow caused one particular price move.
My interpretation is straightforward: the latest institutional flow is supportive, but price acceptance above the nearby range still needs to appear. A positive fund-flow day buys the bullish case another hearing. It does not deliver a verdict.
Ethereum is weaker; Solana is holding up better
Bitcoin’s decline is part of a broader retreat in the captured liquid pairs. The Binance market overview provides the reader-facing venue context; the following figures come from separately captured spot tickers, all quoted in USDT.
| Spot pair | Last price, USDT | Rolling 24-hour change | Quote turnover, USDT |
|---|---|---|---|
| BTC/USDT | 84,226.01 | −1.236% | $1.355 billion equivalent |
| ETH/USDT | 2,617.16 | −2.941% | $983.0 million equivalent |
| SOL/USDT | 118.81 | −0.826% | $223.2 million equivalent |
| BNB/USDT | 768.40 | −1.365% | $90.8 million equivalent |
Ethereum underperformed Bitcoin by about 1.71 percentage points in these windows. Solana outperformed it by about 0.41 percentage points while still falling. Relative strength can mean losing less. The market has a dry sense of humor.
Four pairs are not a complete breadth study. They do, however, undermine the idea that Bitcoin’s ETF inflow automatically produced a broad risk appetite across major crypto assets. ETH weakness deserves attention because a market recovery that depends on one asset has less room for error than one with wider participation.
For an altcoin position, the useful question is whether the asset can preserve relative strength through another Bitcoin test. A smaller decline over one day is a starting observation, not evidence of persistent leadership. The same caution applies to BNB: its presence on the exchange does not insulate it from market selling.
Watch the range before inventing a breakout
The immediate measured references are 83,577 USDT below and 86,699 USDT above, with the 85,280 USDT rolling open between them. These are observed ticker values, not moving averages, liquidation estimates, or confirmed order-book walls.
| Reference | Role in this analysis | What would change the reading |
|---|---|---|
| 83,577 USDT | Captured rolling-day low | A sustained move below would extend the observed downside range |
| 84,226 USDT | Snapshot location | Subsequent prices determine whether the low is being defended |
| 85,280 USDT | Captured rolling-day open | A reclaim would recover the loss within this fixed comparison window |
| 86,699 USDT | Captured rolling-day high | Holding above would be more persuasive than a brief touch |
The middle reference matters because it is easy to mistake a rebound from the low for a recovered market. Bitcoin can bounce several hundred USDT and remain below the captured starting price. A trader should define what counts as recovery before the bounce makes the definition emotionally convenient.
Likewise, the observed low is a candidate support reference, not a guaranteed floor. One rolling window cannot tell us how many times buyers defended it, whether liquidity remains there, or whether a large sell order could push through it. The article preserves what was measured and leaves those unmeasured questions open.
My bullish scenario requires the price to regain the middle of this range, hold its gains, and eventually clear the upper extreme alongside continuing demand. The weaker scenario is a rebound that stalls while the low is tested again. Neither scenario is a probability estimate; they are ways to organize the next evidence.
Keep execution costs visible
If you choose to use Binance to monitor or trade this setup, check the current spread, order size, and fee details before submitting an order. A good thesis can still produce a poor fill.
Sign up on Binance with referral code RATE20 →
The link pre-applies RATE20. Review the displayed referral benefit and eligibility before registering; use the account’s confirmed terms when calculating costs. Our guide explains the offer: Get 20% off with code RATE20.
Limit orders can control the price you accept, but they may not fill. Market orders prioritize execution and can incur slippage. A limit order that immediately crosses the spread can also execute as a taker, so “limit” is not a universal synonym for a lower fee.
Whale withdrawals are a different signal
Exchange withdrawals can reduce immediately available exchange inventory, but they do not automatically represent new buying. Coins may move to self-custody, another venue, an institutional custodian, or a reorganized wallet structure. A transfer is evidence of movement; its economic purpose requires more work.
That matters when interpreting bullish whale headlines alongside modest ETF demand. This research did not establish an independently verified October 7 whale accumulation total, so no such total is used to justify the outlook. Combining unlike signals into one giant “money entering Bitcoin” number would be misleading.
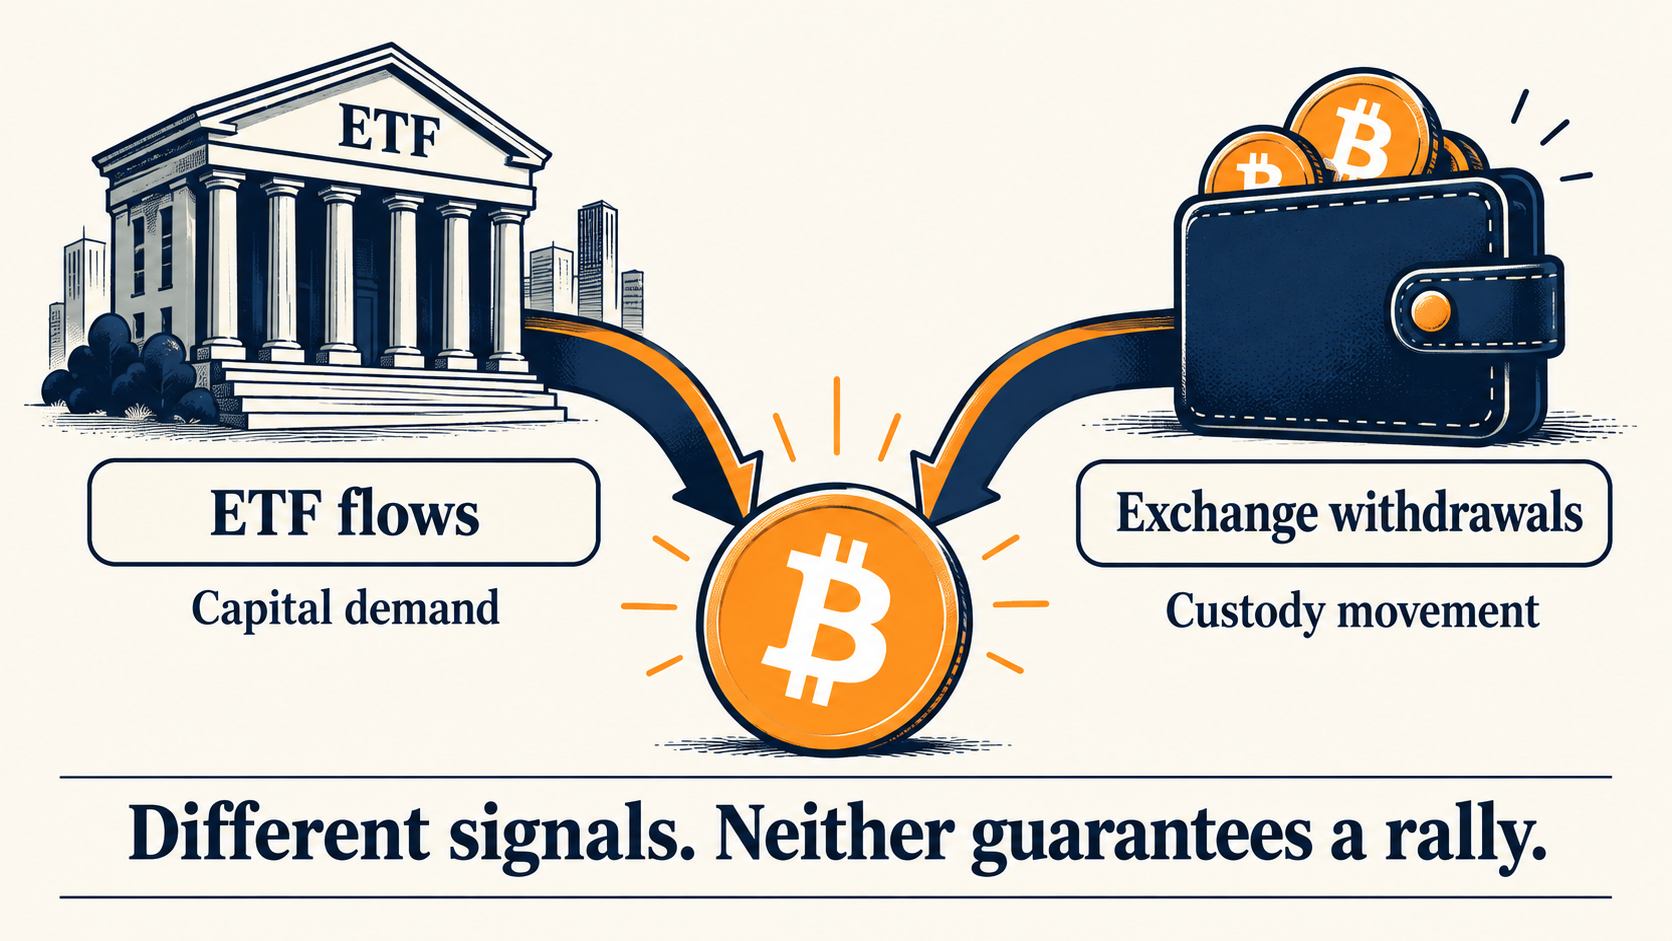
AI-generated conceptual illustration. It separates categories of evidence and does not depict measured flows.
The same restraint applies to supply narratives. Fewer coins at one exchange can support a longer-term scarcity thesis while the market price falls today. Price is set by the orders that meet now, not by a story about every coin that might become harder to buy later.
The broader market still has to absorb supply
The separately captured global aggregate puts crypto capitalization at about $2.878 trillion, with a reported 4.19% decline over 24 hours and Bitcoin dominance of 58.73%. The CoinGecko market charts show the live aggregate. Its underlying update timestamp was 06:56:22 UTC, earlier than the Binance pair snapshots.
The larger aggregate decline and the smaller BTC/USDT decline are not contradictory: they cover different baskets, venues, valuation methods, and update times. Dominance measures share of capitalization, not the direction of fresh fund flows. A high Bitcoin share is compatible with a weak total market.
For dated context, Binance Research’s October report, published October 6, reports September crypto capitalization rising 11.0% to $2.99 trillion and spot Bitcoin ETF inflows of $3.49 billion. It also identifies real yields as a market risk and reports Binance pre-IPO perpetual volume more than doubling to $1.3 billion in September.
Those are prior-month findings. The product activity shows demand for other exchange exposures, not Bitcoin spot purchases. September’s recovery also does not guarantee that October buyers will absorb every seller. My inference from today’s snapshot is that the recovery thesis remains plausible, but its immediate price confirmation is incomplete.
Frequently asked questions
Why is Bitcoin down if ETFs had inflows?
Positive ETF flows do not guarantee a higher Bitcoin price. Other sellers can outweigh that demand, and fund reporting dates differ from a continuously traded spot market’s rolling window. The captured October 6 ETF inflow coexists with a negative BTC/USDT rolling-day change; the data alone does not establish the cause of the decline.
What Bitcoin support and resistance levels matter on October 7?
The captured rolling-day low of 83,577 USDT and high of 86,699 USDT are the clearest measured range references here. The 85,280 USDT opening reference helps judge whether a rebound recovers the captured day’s loss. These levels are observations, not guaranteed turning points, and later data can establish a different range.
Do whale exchange withdrawals mean Bitcoin will rally?
No: withdrawals show custody movement, which can have several explanations. A stronger demand argument combines verified buying, persistent fund inflows, and price holding higher levels. This article does not claim a verified October 7 whale accumulation figure.
The next useful evidence is whether buying persists and Bitcoin holds its rebounds. Until then, the distance from the rolling low tells a less comfortable story than the ETF headline alone.
Create your Binance account with RATE20 →
Referral code: RATE20, pre-applied by the signup link. Check the displayed terms before completing registration. SmallDrift may earn a referral commission from eligible signups.
This article is for informational purposes only and does not constitute financial advice. Always do your own research before making investment decisions.
Get 20% Off Binance Trading Fees with RATE20
New to Binance? Open the official signup page with RATE20 already applied for a 20% trading-fee discount. You do not need to copy or type the code. Review the referral details before completing registration.

- Referral code: RATE20, pre-applied by this link
- Fee discount: 20%, shown on the Binance signup screen
- Additional rewards: Check Binance for current promotions and regional availability
Be wary of unofficial referral offers promising benefits they cannot show. The Binance signup screen lets you check the code and fee discount directly.
Compare Binance fees and available discounts →
SmallDrift may earn a commission when you sign up through this link. Trading involves risk, including loss of capital.
Related Articles



Explore Related Guides
Daily Crypto Market News
Follow Bitcoin price moves, major altcoins, and the events shaping the market.
Bitcoin ETF Flows Guide
Understand ETF inflows and outflows, and how to read them alongside price action.
Binance Fee Calculator
Learn how to estimate trading costs with referral and BNB discounts.
Verified Binance Referral Guide
See how RATE20 is applied and what to check on the Binance signup screen.