Bitcoin Slips to $82,826: Where Are Buyers? — October 8, 2026
Bitcoin falls below $83,000 as ETH and SOL weaken. Uneven ETF buying and a nearby 24-hour low put the quality of the next rebound under scrutiny.

Bitcoin fell to 82,826.38 USDT, while the latest available ETF session still showed net buying. That apparent contradiction becomes less mysterious when you separate the clocks: the price snapshot is from October 8, but the retrieved ETF series ends on October 6. For anyone buying this dip, the question is whether fresh demand arrives before a modest pullback becomes another failed rebound.
The market is offering a test, not an answer. Ethereum and Solana are losing more ground than Bitcoin, BNB is approximately flat, and BTC sits closer to its rolling daily low than its high. One green ETF row does not turn that into a broad recovery.
Research cutoff: October 8, 2026, 07:02:33 UTC. Binance spot figures below were retrieved around 07:00:51 UTC; each pair uses its own rolling 24-hour window. Linked market pages show current data and may differ from this historical snapshot. ETF reporting dates and weekly research periods are identified separately.
What is Bitcoin doing on October 8?
BTC/USDT is down 1.671% over its rolling 24-hour window, with a last price of 82,826.38 USDT. Its observed low was 82,227.56 and high was 84,309.89. Those are exchange-specific prices quoted in USDT, rather than a universal dollar close.
| Binance spot pair | Last price, USDT | Rolling 24h change | Rolling 24h low | Rolling 24h high |
|---|---|---|---|---|
| BTC/USDT | 82,826.38 | −1.671% | 82,227.56 | 84,309.89 |
| ETH/USDT | 2,564.82 | −2.000% | 2,538.06 | 2,622.04 |
| SOL/USDT | 115.21 | −3.038% | 114.22 | 119.02 |
| BNB/USDT | 768.67 | +0.029% | 762.39 | 776.23 |
Source: the spot ticker snapshot corresponding to Binance’s official market overview. The BTC window runs from October 7, 07:00:51.002 UTC to October 8, 07:00:51.002 UTC; the other pairs end within roughly a quarter of a second of that timestamp. Prices and changes are rounded only as displayed above.
The practical difference between a daily window and a calendar-day return matters. A rolling ticker compares the latest trade with a trade approximately 24 hours earlier. It does not tell you how much Bitcoin has moved since midnight in New York, London, or UTC. Comparing it with a headline that uses a different close can manufacture a disagreement where none exists.
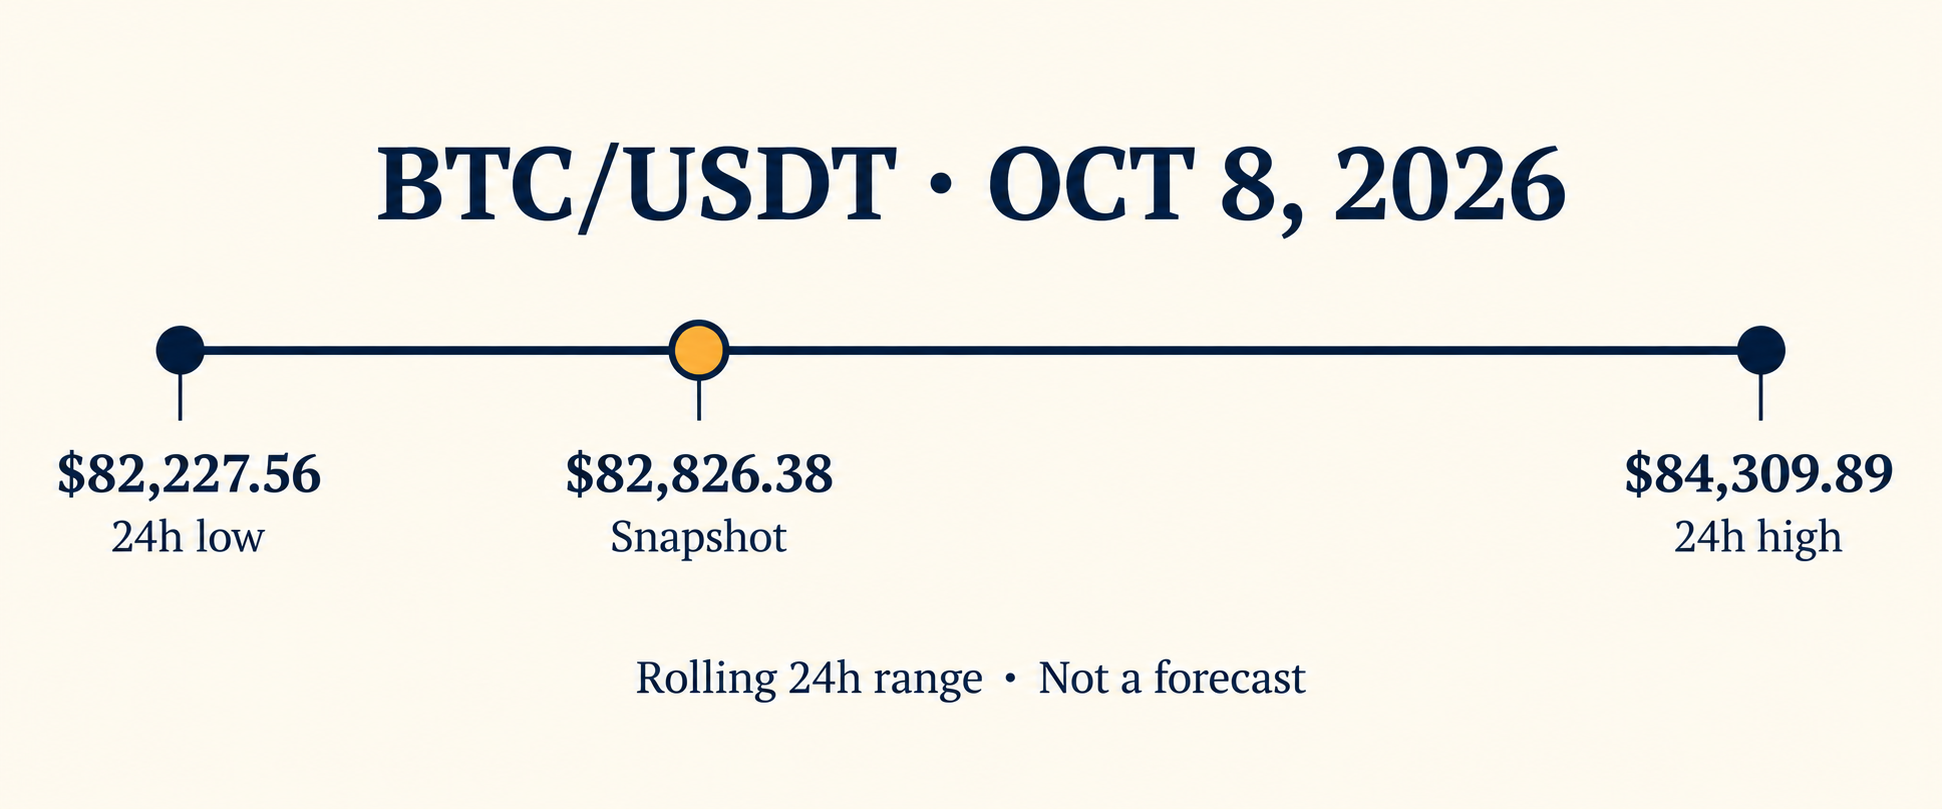
AI-generated range illustration using the retrieved ticker values. Dollar symbols in the graphic are shorthand for the USDT quote; this is not a historical price path or forecast.
The nearest price test is only 0.72% away
At the snapshot, BTC is 598.82 USDT above the rolling low. That is approximately 0.72% of the last price. The rolling high is 1,483.51 USDT above it, or approximately 1.79%.
These distances describe the setup more usefully than a vague claim that Bitcoin is “holding strong.” The coin is trading in the lower 29% of the observed range. Buyers have room to improve the picture, but they have not yet reclaimed the upper part of it.
| Reference level | Why it matters | What would improve or weaken the setup |
|---|---|---|
| 82,227.56 USDT | Retrieved rolling 24h low; first downside reference | A sustained break below it would extend the observed range downward |
| 83,000 USDT | Nearby round-number checkpoint, chosen for this analysis | Holding above it would be an initial recovery, not a breakout |
| 84,309.89 USDT | Retrieved rolling 24h high; first upside reference | Reclaiming it with continued buying would strengthen the rebound case |
A single rolling low is not proven technical support. Establishing support usually requires more evidence: repeated reactions, traded volume, and behavior after a level is tested. The same caution applies to the high. Treat these numbers as places to watch execution and price acceptance, rather than automatic buy and sell orders.
The stronger bullish sequence would be a defense of the lower boundary, a recovery through 83,000, and then an attempt to establish trading above the old daily high. The weaker sequence would be a brief bounce followed by another low. Neither sequence is guaranteed, and this snapshot does not provide a probability for either outcome.
ETF demand is positive on one day and narrow across two
The retrieved TFTC US spot Bitcoin ETF tracker contains data through October 6. Its two most recent sessions show approximately $89.90 million of net outflows on October 5 and $118.86 million of inflows on October 6. Together, they add up to approximately $28.96 million of net inflows.
| ETF reporting date | Aggregate net flow, USD | IBIT net flow, USD |
|---|---|---|
| October 5, 2026 | −$89.90 million | +$69.85 million |
| October 6, 2026 | +$118.86 million | +$122.00 million |
| Two-session total, calculated | +$28.96 million | +$191.85 million |
The implication is narrower than “institutions are buying everything.” IBIT attracted capital on both dates, while the other tracked funds collectively offset much of that buying. Aggregate demand remained positive over the pair of sessions, but participation was uneven.
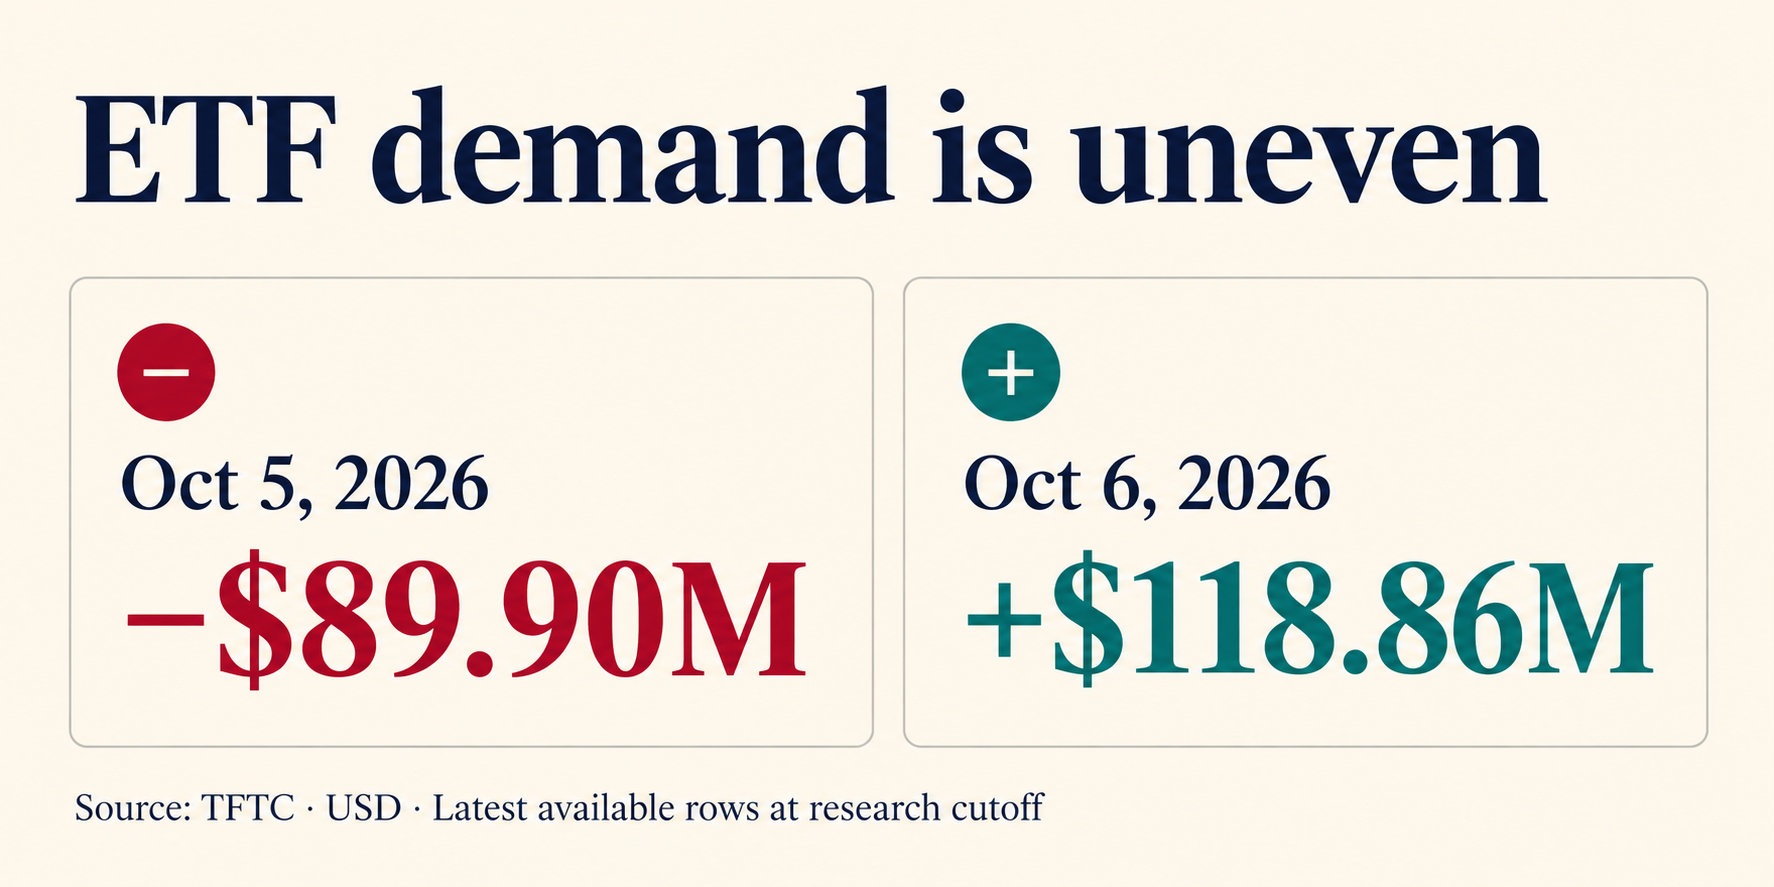
AI-generated data cards. Figures are rounded from the preserved TFTC response; no October 7 or October 8 ETF flow is implied.
An ETF flow is also not the same thing as every dollar traded in the fund. Secondary-market share turnover and net creations or redemptions measure different activity. A busy trading day can coexist with little net new exposure. That distinction keeps a popular volume headline from doing work it cannot support.
Most importantly, an October 6 flow cannot explain every trade on October 8. Investors could have changed their behavior since then. The honest reading is that recent reported demand offers some support for the institutional-buying thesis, while the latest spot market is still asking for confirmation. Wall Street can buy on Tuesday without promising to catch Thursday’s knife.
What the weekly on-chain evidence does—and does not—show
Glassnode’s October 5 Market Pulse, covering the week to October 4, reported spot cumulative volume delta improving from −$102.8 million to +$33.2 million. Futures open interest fell from $38.0 billion to $36.6 billion, while long-side funding payments rose from roughly $926,400 to $1.5 million. Its weekly ETF netflow reading was positive at $208.1 million but had cooled sharply.
Those observations suggest more aggressive spot buying and reduced futures exposure alongside a higher cost of bullish positioning. They are weekly context, not today’s readings. Their periods also differ from the daily ETF table above.
On-chain, Glassnode reported 73.6% of supply in profit and a higher realized profit-to-loss ratio. That leaves room for holders to sell profitably. It does not establish that whales accumulated a particular number of coins today. No independently verified current whale-buying total was available for this article, so none is asserted.
For a trader, the useful question is how these forces meet at the next test. A market can have healthier spot activity than it did a week earlier and still fall if available buyers cannot absorb selling at the current price. Improving demand is a direction of travel; adequate demand is a price-dependent condition.
Altcoins are not confirming a broad risk-on move
SOL’s 3.038% decline exceeds BTC’s loss by 1.367 percentage points. ETH trails BTC by 0.329 percentage points. BNB’s 0.029% gain is small enough to describe as essentially flat, rather than a decisive breakout.
That makes the four-pair snapshot uneven. It does not prove an industry-wide altcoin capitulation, and it does not establish a rotation into BNB. Four large assets are a useful comparison basket, not the entire market.
The separately retrieved global response corresponding to CoinGecko’s official market charts put total crypto market capitalization at approximately $2.831 trillion, down 4.389% over 24 hours, with BTC dominance near 58.74%. Its update timestamp was October 8, 06:59:14 UTC. That broader decline supports caution, although coverage and timing differ from Binance’s pair data.
The API’s global volume fields contained an apparent anomaly and are excluded here. The linked chart page may also display different figures as data refreshes. Mixing a later webpage value with an earlier API snapshot would give the appearance of precision while quietly changing the observation.
A more convincing recovery would include improving relative performance from ETH and SOL, rather than Bitcoin bouncing while those assets keep printing lower prices. Breadth matters because it shows whether willingness to take risk is spreading. Until then, the simpler interpretation is selective resilience inside a weaker market.
A Binance product update is useful context, not a price catalyst
In a September 30 official announcement from PayPay, the company said Binance Pay had joined its Japanese merchant payment network through HIVEX. Eligible overseas users can access the integration; domestic residents and some merchants are excluded.
That is a concrete payments development, but it is not evidence of new spot demand for BTC or BNB on October 8. Spending access, exchange activity, and investment flows are different channels. A product headline needs a demonstrated link to asset demand before it belongs in a price-catalyst argument.
If you choose to use Binance where it is available, check your local eligibility and the displayed fee schedule before opening a position.
Create a Binance account with RATE20 →
The link pre-applies RATE20. Review the displayed referral terms and confirm whether the advertised 20% trading-fee discount applies to your account before registration. SmallDrift may receive a referral commission. The Get 20% off with code RATE20 guide explains the signup process and checks to make.
What would change the market call?
The central risk is buying an early bounce as though every demand measure has already turned. The central opportunity is that a shallow price test could attract buyers before broader sentiment improves. The evidence needed to separate those outcomes is straightforward:
- Price acceptance: Does BTC establish trading above 83,000 and then challenge 84,309.89, or repeatedly fail on the way up?
- Breadth: Do ETH and SOL stabilize alongside Bitcoin, rather than merely falling more slowly?
- Reported demand: Do later ETF sessions show sustained net buying across more funds?
- Execution: Is liquidity sufficient for the order size, and is the downside tolerable if the rolling low breaks?
None of these checks requires a dramatic forecast. They require deciding in advance what would invalidate a trade. A stop level without a position size is only half a risk plan; a large enough position can make a small move expensive.
Fees also matter when repeatedly trading a narrow range, but a discount cannot rescue poor execution or an oversized position. Compare the actual maker or taker charge, spread, and expected slippage for the product you use. A limit order is not automatically a maker order if it crosses the spread immediately.
Review Binance signup with RATE20 →
Confirm the referral benefit and any optional BNB fee-payment terms in your account. Discount availability depends on the product, account, and current terms; this article does not assume that multiple benefits stack for every reader.
Frequently asked questions
Why is Bitcoin falling despite ETF inflows?
The positive ETF figure and the falling price refer to different observation periods. The latest retrieved ETF row is October 6, while BTC’s 1.671% decline is a rolling spot return ending around 07:00 UTC on October 8. ETF demand is one part of the market, and the missing later rows cannot be treated as either zero flows or continued buying.
What Bitcoin support and resistance levels matter today?
The nearest observed references are 82,227.56 USDT below and 84,309.89 USDT above. They are Binance BTC/USDT rolling 24-hour extremes, not independently confirmed support and resistance. The 83,000 round number is an intermediate checkpoint selected for this analysis.
Are altcoins outperforming Bitcoin on October 8?
ETH and SOL underperform BTC in the retrieved four-pair basket; BNB is approximately flat. That supports a cautious reading of market breadth. It does not establish the performance of every altcoin or predict which asset will lead the next session.
This article is for informational purposes only and does not constitute financial advice. Always do your own research before making investment decisions.
Get 20% Off Binance Trading Fees with RATE20
New to Binance? Open the official signup page with RATE20 already applied for a 20% trading-fee discount. You do not need to copy or type the code. Review the referral details before completing registration.

- Referral code: RATE20, pre-applied by this link
- Fee discount: 20%, shown on the Binance signup screen
- Additional rewards: Check Binance for current promotions and regional availability
Be wary of unofficial referral offers promising benefits they cannot show. The Binance signup screen lets you check the code and fee discount directly.
Compare Binance fees and available discounts →
SmallDrift may earn a commission when you sign up through this link. Trading involves risk, including loss of capital.
Related Articles



Explore Related Guides
Daily Crypto Market News
Follow Bitcoin price moves, major altcoins, and the events shaping the market.
Bitcoin ETF Flows Guide
Understand ETF inflows and outflows, and how to read them alongside price action.
Binance Fee Calculator
Learn how to estimate trading costs with referral and BNB discounts.
Verified Binance Referral Guide
See how RATE20 is applied and what to check on the Binance signup screen.