Bitcoin Tests $85K After ETF Exit — October 6, 2026
Bitcoin trades near its 24-hour low as $89.8 million leaves U.S. spot ETFs. IBIT buying offsets only part of the redemptions at Fidelity and ARK.

Bitcoin fell to $85,280 even while BlackRock’s IBIT attracted $69.9 million. Redemptions at Fidelity and ARK were larger, leaving U.S. spot Bitcoin ETFs with a $89.8 million net outflow for October 5. The useful question today is whether the $85,000 area can absorb that selling, rather than whether one familiar buyer is still buying.
Research cutoff: October 6, 2026, 07:01:57 UTC. Binance ticker snapshots were retrieved around 07:00 UTC, followed by daily candles and checks of the linked research pages. Requests were sequential, so the observations are close in time but not simultaneous. Linked market pages show current data; this article preserves the historical research snapshot at the stated cutoff. ETF figures refer to completed U.S. trading sessions, not the crypto market’s rolling 24-hour window.
What is Bitcoin doing on October 6?
Binance BTC/USDT traded at 85,280.01 USDT, down 1.095% over its rolling 24-hour window. The last trade was only 308 USDT above the window’s low, while the opening price remained almost 944 USDT overhead. Buyers had defended the bottom so far, but they had not recovered the ground lost during the session.
The official Binance market overview provides reader-readable prices across these pairs. Values below are quote-currency amounts in USDT; calling them dollars is shorthand, not an assertion that USDT and USD always trade identically.
| Binance spot pair | Snapshot price, USDT | Rolling 24h change | Rolling 24h quote volume |
|---|---|---|---|
| BTC/USDT | 85,280.01 | -1.095% | 1.165 billion USDT |
| ETH/USDT | 2,696.47 | -1.059% | 632.14 million USDT |
| SOL/USDT | 119.80 | -1.399% | 161.50 million USDT |
| BNB/USDT | 779.03 | -1.867% | 77.93 million USDT |
All four sampled pairs declined. BNB had the weakest return in this small comparison, while Ether tracked Bitcoin relatively closely. That is evidence of broad pressure among these liquid pairs, not a complete survey of every token or exchange.
Bitcoin’s rolling high was 86,725.12 and its low was 84,972.01: a range of 1,753.11 USDT, roughly 2.03% of the rolling opening price. The snapshot sat just 17.6% of the way up that range. A price can remain above a round number while still trading near the bottom of its recent auction. The green line on a chart does not get a vote.
Is the wider crypto market confirming the weakness?
CoinGecko’s global snapshot showed market capitalization down 2.305% over 24 hours, with reported volume up 27.706%. Total capitalization was approximately $2.916 trillion, and aggregate 24-hour volume was $81.50 billion. Bitcoin dominance stood at 58.66%.
The CoinGecko global market charts supply the wider context. These aggregates combine assets and venues using CoinGecko’s methodology. Their USD market-cap change is not directly interchangeable with the BTC/USDT return on one exchange.
Higher reported turnover alongside lower capitalization is consistent with a more active selloff. It does not establish that every trade was aggressive selling: every executed trade has a buyer and a seller. Nor does rising volume prove a bottom is forming. To distinguish absorption from continued distribution, traders need subsequent price behavior and more detailed execution data.
Bitcoin’s dominance is a share of total crypto capitalization, not a measure of its absolute health. A large share can coexist with falling prices, especially if smaller assets lose more value. Today’s four-pair table supports caution about an immediate altcoin rotation; it does not support sweeping claims that all capital is migrating into Bitcoin.
Why did Bitcoin ETFs lose $89.8 million despite IBIT buying?
Fidelity’s FBTC and ARK’s ARKB together lost $159.7 million, outweighing IBIT’s $69.9 million inflow. The October 5 row in Farside Investors’ Bitcoin ETF table reports zero net flow for the other listed funds. Those zeros are reported values in the retrieved table, rather than missing entries treated as zero.
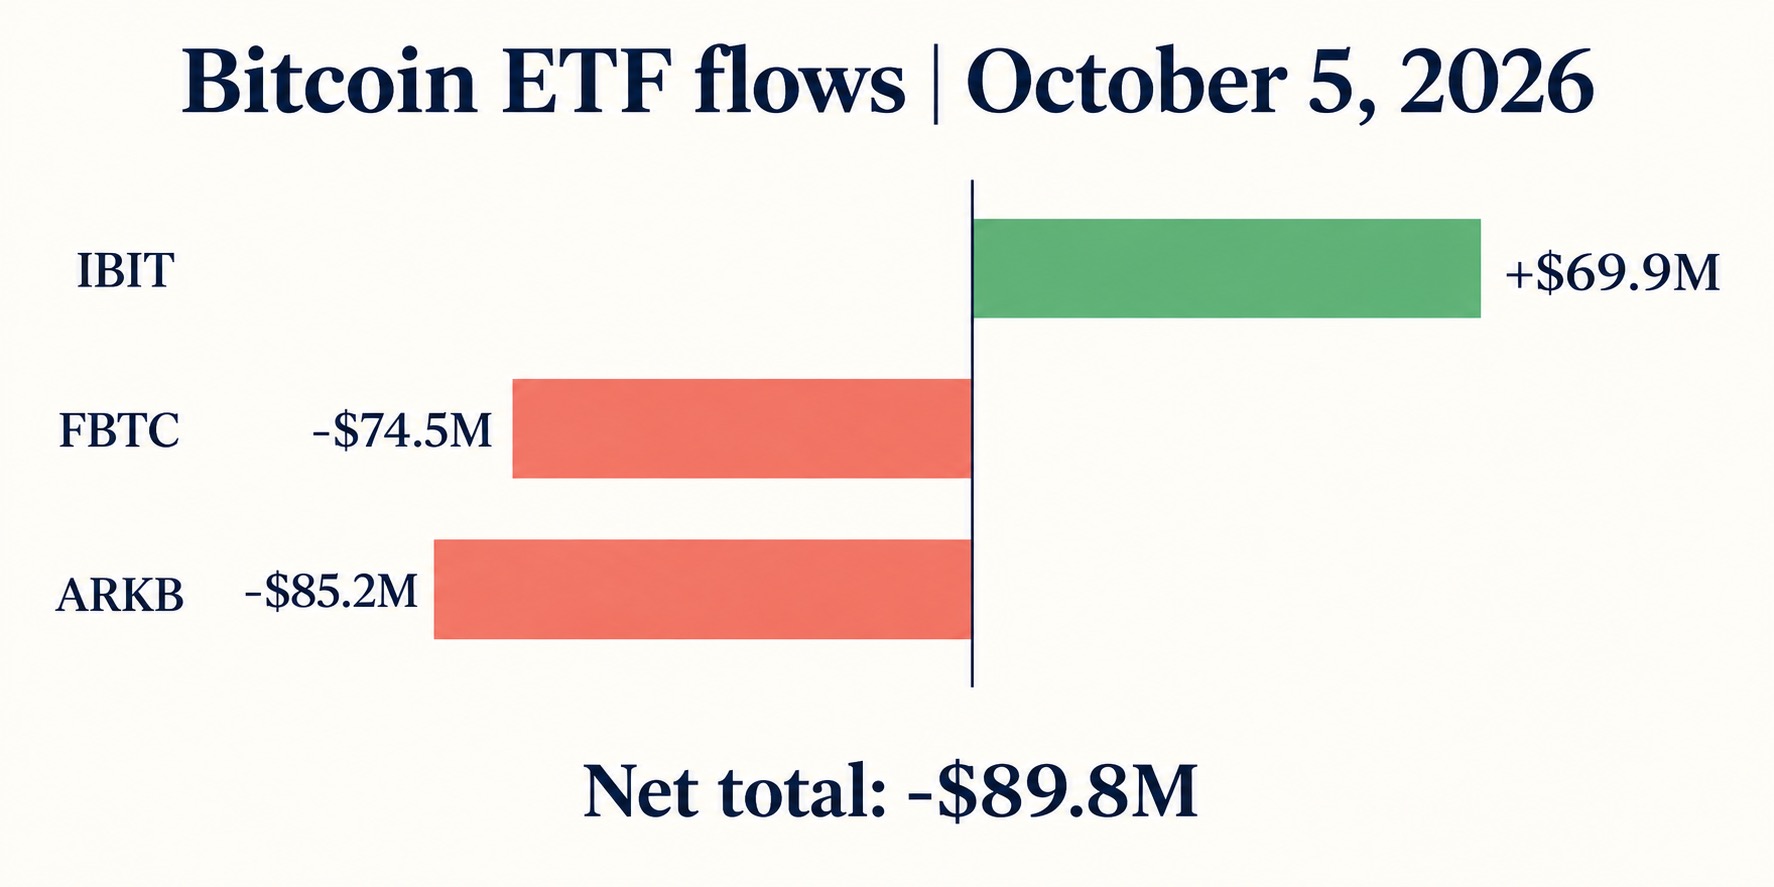
AI-generated flow illustration; bar lengths are schematic, not to scale. Exact values are listed below.
| U.S. spot Bitcoin ETF | October 5 net flow |
|---|---|
| BlackRock IBIT | +$69.9 million |
| Fidelity FBTC | -$74.5 million |
| ARK 21Shares ARKB | -$85.2 million |
| Other listed funds combined | $0.0 million |
| Total | -$89.8 million |
The arithmetic matters more than the brand recognition. A headline about BlackRock buying can be accurate while leaving readers with the wrong impression about the category as a whole. Here, two large redemptions outweighed that purchase channel.
Monday also reversed the direction of the preceding two sessions: Farside’s displayed totals were +$102.7 million on October 1 and +$189.9 million on October 2. Those two inflows sum to $292.6 million; subtracting Monday’s $89.8 million leaves $202.8 million net positive across those three sessions. This is a limited three-session calculation, not a weekly total or an uninterrupted streak.
That distinction prevents overreaction in both directions. Monday was an outflow day, but it did not erase the previous two days’ combined inflows. Conversely, the residual positive balance does not prove institutional demand is accelerating. The most recent observation points the other way.
ETF flows measure one investment channel. They do not identify all spot buyers, reveal every hedging position, or timestamp the exact exchange trades associated with creations and redemptions. Matching an ETF outflow with a falling Bitcoin price is useful context; declaring it the sole cause of the decline goes beyond the evidence.
Which Bitcoin price levels matter now?
The immediate downside reference is the 84,972.01 rolling low; the first meaningful recovery test is 86,224.00, the rolling opening price. The round 85,000 area is nearby, but the observed low is the more precise record of where trading actually reached.
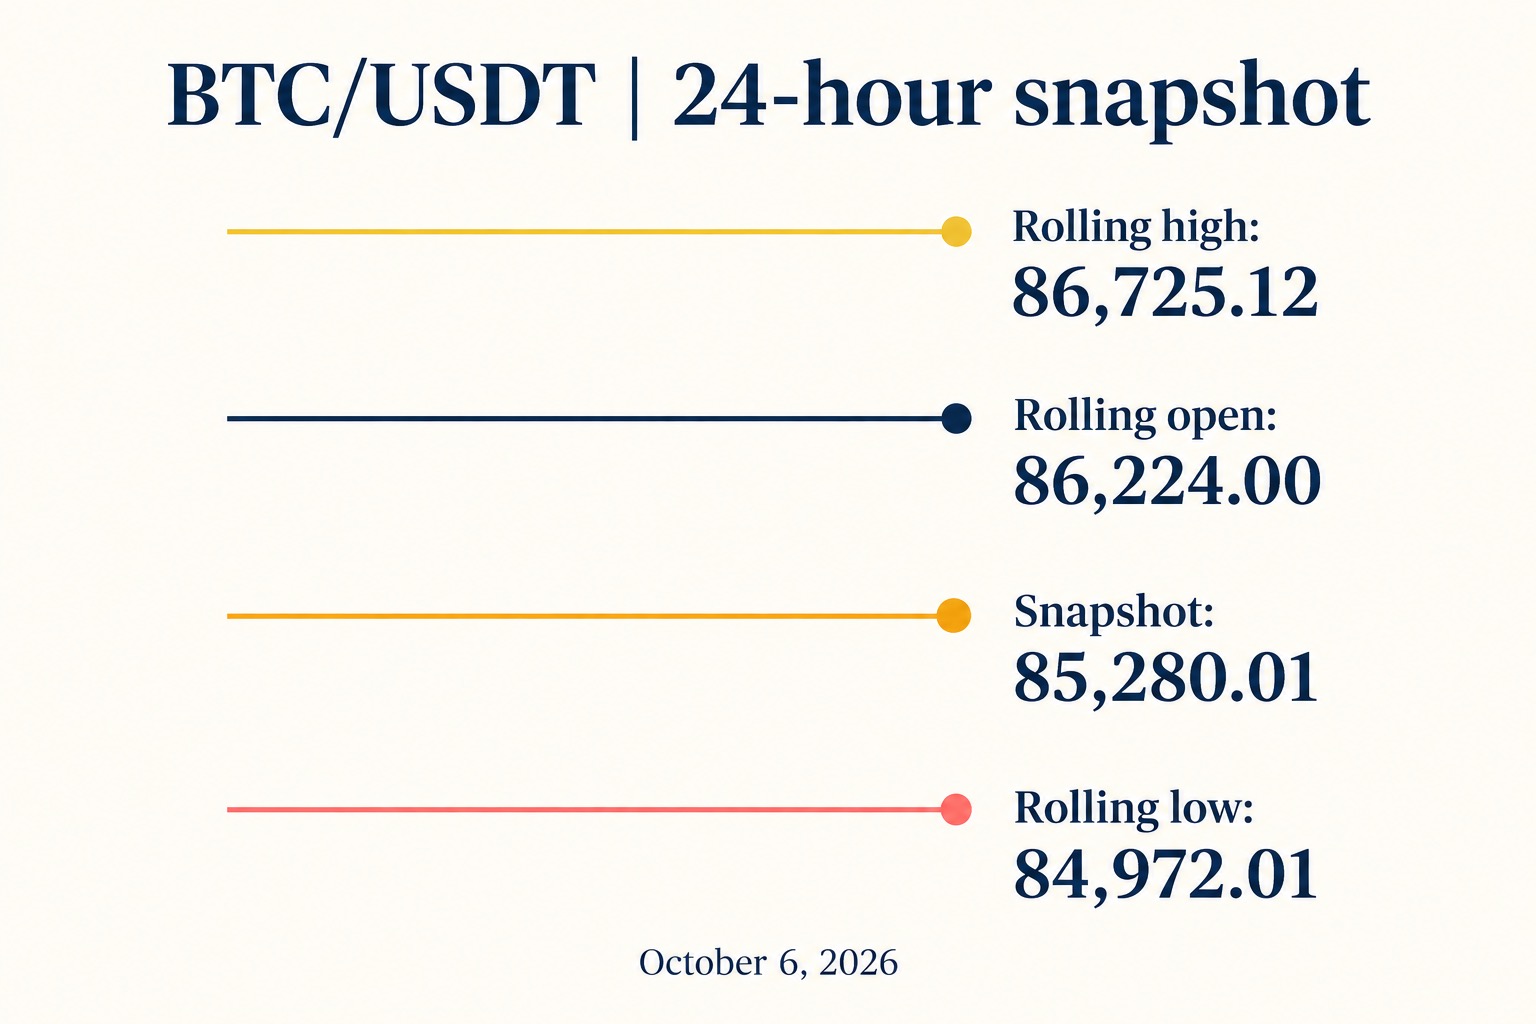
AI-generated reference ladder; vertical spacing is schematic, not a price scale.
| BTC/USDT reference | Basis | Conditional interpretation |
|---|---|---|
| 84,972.01 | Rolling 24h low; also October 5 daily low | Trading below it would extend the local decline |
| 85,000 | Nearby round number | Holding it matters only if buyers also defend the observed low |
| 85,766.87 | October 5 completed UTC daily close | A reclaim would recover the prior session’s closing reference |
| 86,224.00 | Rolling 24h opening price | A reclaim would erase the sampled rolling-window loss |
| 86,725.12 | Rolling 24h high | Sustained trading above it would improve the immediate structure |
| 86,999.11 | October 5 completed UTC daily high | A larger recovery test after the rolling high |
At the snapshot price, the rolling low was about 0.36% below, while the rolling high was approximately 1.69% above. These distances describe the geometry of the current range. They are not a ready-made risk/reward ratio: actual entries, exits, execution costs and invalidation rules would determine that.
A constructive scenario requires buyers to retain the low, reclaim the previous daily close and then recover the rolling opening price. A weaker bounce could stop at either of those intermediate references. A downside continuation would begin with trading below the low, although even that would need follow-through to distinguish a sustained break from a short-lived sweep.
These levels come from retrieved exchange prices, not a claim that large orders are permanently waiting there. Order books change. Historical highs and lows remain useful references precisely because they describe completed behavior rather than promise future liquidity.
Is trading activity stronger than the weekend?
Monday’s completed UTC session traded 1.392 billion USDT on BTC/USDT, about twice Sunday’s 683.67 million USDT. Its close fell from Sunday’s 86,530.00 to 85,766.87. More turnover accompanied a lower close as weekday participation resumed.
| Completed UTC day | BTC/USDT high | Low | Close | Quote volume |
|---|---|---|---|---|
| October 4 | 86,800.00 | 84,719.99 | 86,530.00 | 683.67 million USDT |
| October 5 | 86,999.11 | 84,972.01 | 85,766.87 | 1.392 billion USDT |
The increase was approximately 103.6%, calculated from two completed daily candles. Tuesday’s candle was still incomplete at research time and is excluded from this comparison. Comparing a partial morning with a whole prior day would manufacture a volume collapse from the clock.
The rolling ticker’s 1.165 billion USDT covers a different interval: approximately 07:00 UTC October 5 to 07:00 UTC October 6. Daily candles run midnight to midnight UTC. Both are valid measures, but they answer different questions. Today’s rolling decline and Monday’s lower daily close fit the same cautious reading without requiring their volumes to match.
If you choose to trade this range
A narrow distance to the recent low can tempt traders to increase position size. That is also where a brief price sweep can invalidate a tightly placed stop. Decide what behavior would invalidate your interpretation before choosing size, and account for spread and slippage alongside the advertised trading fee.
Create a Binance account with referral code RATE20 →
This is a referral signup link with RATE20 pre-applied. Review the referral benefit displayed during registration and the terms available in your jurisdiction before opening an account. SmallDrift may earn a referral commission. Account availability and discounts can vary; a market setup is not a reason to assume eligibility.
What about whale activity and Binance announcements?
The retrieved evidence does not establish a fresh whale-accumulation signal for this snapshot. Large transfers can reflect custody movements, exchange wallets or internal reorganizations, rather than a new investment decision. Without reliable address attribution and a defined measurement window, assigning a bullish motive would be speculation.
For venue operations, the official Binance announcement page lists a Ronin network upgrade and hard-fork support notice for October 7, alongside earlier listing and pair-removal notices. This is an operational check, not evidence that a new exchange announcement caused today’s Bitcoin move. Anyone using the affected network should inspect the actual notice and timing before transferring assets.
Neither a maintenance notice nor an unverified whale narrative changes the central evidence: Bitcoin is near its rolling low, the sampled large-cap pairs are weaker, and the latest completed U.S. ETF session had net redemptions. The next useful update is observable demand, not a more colorful explanation of the same candles.
Keep execution costs proportionate
Frequent entries and exits can turn a modest range into an expensive habit. A limit order is not automatically a maker order: if it crosses the spread and executes immediately, it can incur taker fees. Check the order’s execution behavior and your applicable fee schedule rather than assuming that the word “limit” guarantees a discount.
For the signup details, see Get 20% off with code RATE20. Treat any illustrated fee stacking as conditional on the product, account tier, BNB-payment setting and benefits actually displayed to you. A spot discount does not automatically describe a futures account’s costs.
Review Binance registration with RATE20 →
The link pre-applies the referral code. Confirm the displayed benefit before completing registration. Saving fees helps control costs; it does not rescue a position whose original market thesis has failed.
Frequently asked questions
Why is Bitcoin falling if BlackRock is buying?
IBIT’s $69.9 million inflow was smaller than the combined $159.7 million outflow from FBTC and ARKB on October 5. The ETF category therefore recorded a $89.8 million net outflow. Spot markets, derivatives and other investment channels also influence Bitcoin, so these flows provide context without proving a single cause.
Is $85,000 Bitcoin support on October 6, 2026?
The observed nearby downside reference is 84,972.01 USDT on Binance BTC/USDT, rather than an exact $85,000 floor. Bitcoin traded at 85,280.01 in the research snapshot. Holding that area would preserve the local range; it would not establish that the broader decline is over.
Are the prices in the linked market pages the article’s prices?
No. Linked market pages show current data, while this article records the October 6 research snapshot. Exchange prices, rolling windows and provider update times differ. The research provenance preserves the actual API requests and available responses so later readers can distinguish the saved observation from today’s live quote.
This article is for informational purposes only and does not constitute financial advice. Always do your own research before making investment decisions.
Get 20% Off Binance Trading Fees with RATE20
New to Binance? Open the official signup page with RATE20 already applied for a 20% trading-fee discount. You do not need to copy or type the code. Review the referral details before completing registration.

- Referral code: RATE20, pre-applied by this link
- Fee discount: 20%, shown on the Binance signup screen
- Additional rewards: Check Binance for current promotions and regional availability
Be wary of unofficial referral offers promising benefits they cannot show. The Binance signup screen lets you check the code and fee discount directly.
Compare Binance fees and available discounts →
SmallDrift may earn a commission when you sign up through this link. Trading involves risk, including loss of capital.
Related Articles



Explore Related Guides
Daily Crypto Market News
Follow Bitcoin price moves, major altcoins, and the events shaping the market.
Bitcoin ETF Flows Guide
Understand ETF inflows and outflows, and how to read them alongside price action.
Binance Fee Calculator
Learn how to estimate trading costs with referral and BNB discounts.
Verified Binance Referral Guide
See how RATE20 is applied and what to check on the Binance signup screen.