Bitcoin's $21M ETF Return Falls Short — October 11, 2026
Bitcoin rebounds near $83,168, but Friday's $21.1 million ETF inflow offsets just 2.9% of the prior two sessions' $729 million exit.

Bitcoin ETFs brought back $21.1 million on Friday after losing $729 million across the previous two sessions. Bitcoin itself has recovered to roughly $83,168, but the returning fund demand replaces only about 2.9% of that exit. The weekend question is whether buyers can rebuild the price structure before the next U.S. trading session tests their conviction.
Research cutoff: October 11, 2026, 06:53:00 UTC. Spot ticker and candle snapshots were retrieved at approximately 06:53 UTC, immediately after rechecking the linked research pages. Requests were sequential, not simultaneous. Linked market pages show current data; the figures here preserve the research snapshots stated in this article. ETF figures cover dated U.S. trading sessions. Exchange percentage changes cover rolling 24-hour windows, and daily candles use UTC boundaries.
Is Bitcoin recovering on October 11?
Yes: Binance BTC/USDT was up 0.444% over its rolling 24-hour window, at 83,167.50 USDT. That is a recovery, but it is still below the October 8 high of 83,521.15. A positive daily change answers whether price improved over one window; it does not answer whether the earlier breakdown has been repaired.
The official Binance market overview provides the reader-readable market page for these spot pairs. All prices and quote volumes below are denominated in USDT, not independently measured U.S. dollars. USDT usually trades close to USD, but the distinction matters when comparing exchange prices with dollar-denominated ETF flows.
| Binance spot pair | Snapshot price, USDT | Rolling 24h change | Rolling 24h quote volume |
|---|---|---|---|
| BTC/USDT | 83,167.50 | +0.444% | 593.93 million USDT |
| ETH/USDT | 2,506.90 | +0.483% | 389.36 million USDT |
| SOL/USDT | 109.83 | -0.064% | 97.08 million USDT |
| BNB/USDT | 748.58 | +0.047% | 39.11 million USDT |
Three of the four pairs are positive in this latest observation, while SOL is slightly negative. Participation is mixed, and four large assets are not a complete measure of market breadth. Small tokens can behave very differently, particularly when liquidity thins over the weekend.
Bitcoin’s rolling high was 83,210.01 USDT and its low was 82,640.00. The last price sits approximately 43 USDT below the high. Buyers have pushed toward the top of the latest range; the more demanding test remains above it.
Volume also needs careful interpretation. A ticker’s quote volume counts executed trading turnover. It is not a net inflow of fresh money, and buying and selling both contribute to it. Calling every busy session “capital entering Bitcoin” is an efficient way to turn a useful statistic into a slogan.
What does the $21.1 million ETF return actually change?
Friday’s inflow interrupts the selling streak, but replaces only a small fraction of Wednesday and Thursday’s withdrawals. Farside Investors’ Bitcoin ETF table reports the following totals in U.S. dollars:
| U.S. trading session | Net spot Bitcoin ETF flow |
|---|---|
| October 7, 2026 | -$484.9 million |
| October 8, 2026 | -$244.1 million |
| October 9, 2026 | +$21.1 million |
| October 7–9 combined, calculated | -$707.9 million |
Friday included $22.4 million into IBIT and $2.3 million into HODL, against $3.6 million leaving FBTC. The other displayed fund readings were zero. These are the reported figures at the cutoff and can be revised.
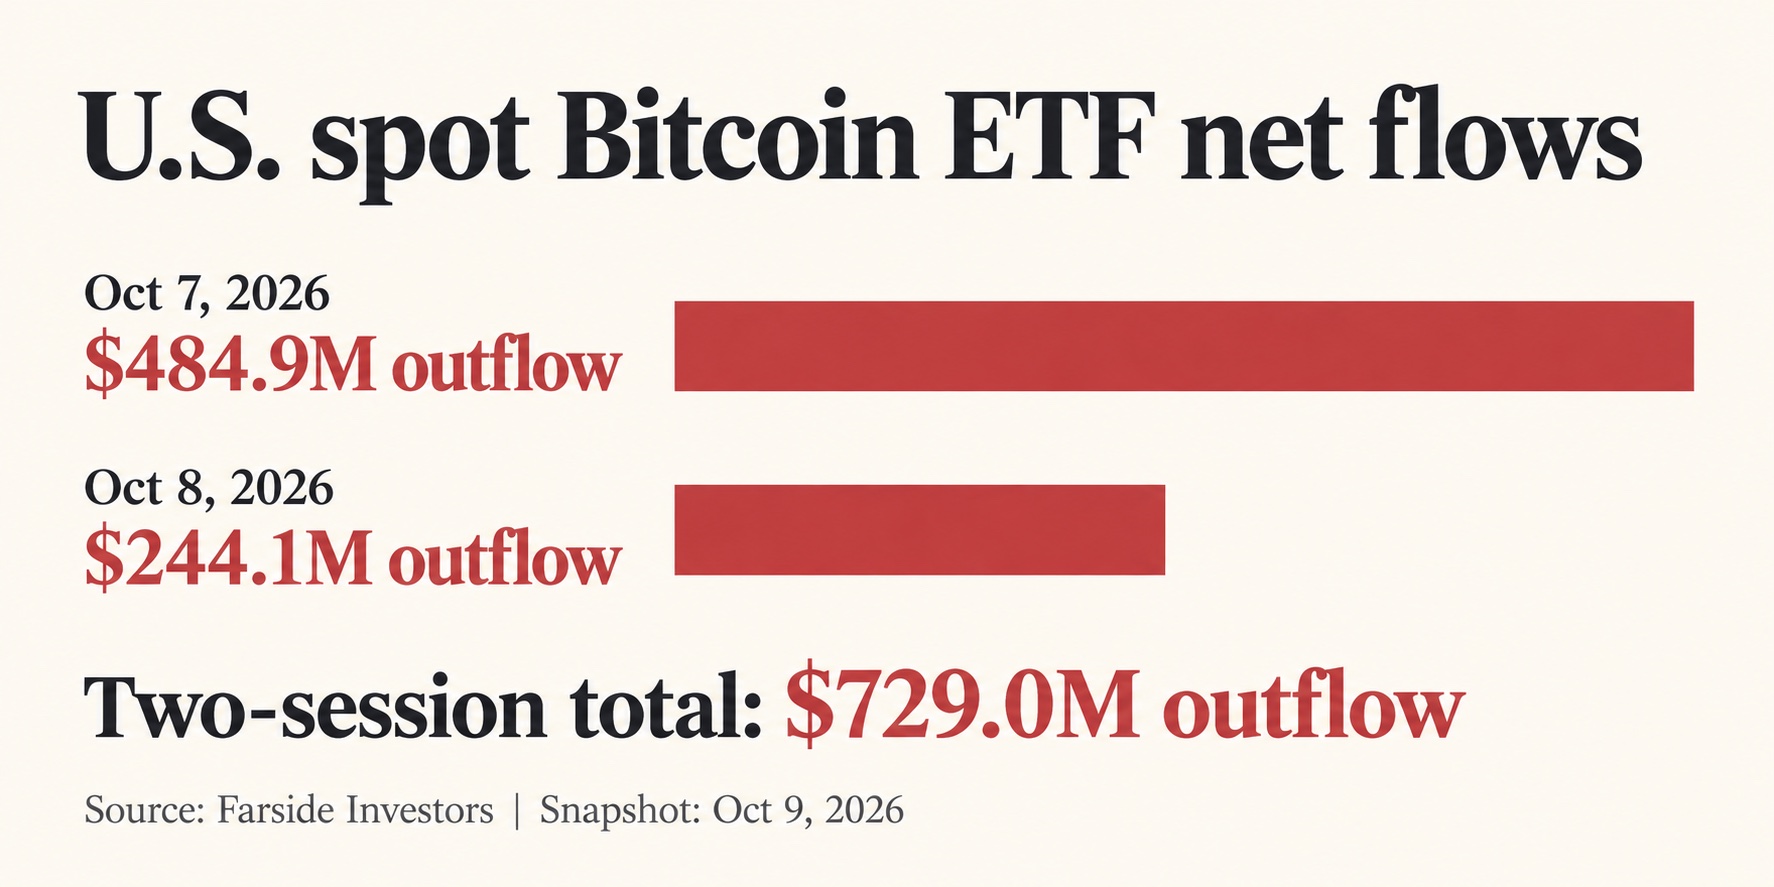
AI-generated infographic showing the October 7–8 exit, based on the October 9 research snapshot. Friday’s subsequently reported $21.1 million inflow appears in the table above.
The arithmetic is straightforward: 21.1 divided by 729 is approximately 2.9%. It would therefore be premature to describe Friday as a full reversal of the preceding withdrawal. Equally, one small inflow does not prove that selling will resume. The next reporting cycle has to supply that evidence.
My interpretation is that the direction improved faster than the magnitude. That is an analytical judgment, not another data point. A durable recovery would be more convincing if incoming fund demand persisted while Bitcoin held reclaimed levels, rather than requiring each small inflow to carry the entire bullish argument.
ETF flows are one demand channel. They do not capture all offshore exchange activity, treasury purchases, miner selling, or holder transfers. Price can rebound while fund flows remain weak because other participants are buying or because immediate selling pressure has eased. Those explanations require additional evidence before assigning them a specific numerical weight.
Which Bitcoin levels matter after the rebound?
The clearest nearby test is 83,521.15 USDT, the October 8 daily high; 81,754.45 is that session’s close. These are observable Binance candle levels used as analytical reference points, not promises that orders are concentrated there.
The official BTC/USDT spot trading page lets readers inspect the live chart. Our daily-candle research separates completed sessions from the still-forming October 11 UTC candle. An unfinished candle’s last price must not be presented as a final daily close.
| Reference level, USDT | Evidence | What I would watch |
|---|---|---|
| 83,521.15 | October 8 UTC daily high | Whether price can reclaim and hold above the earlier range ceiling |
| 83,210.01 | Latest rolling 24h high | Whether the immediate advance continues |
| 82,640.00 | Latest rolling 24h low | Whether the newest recovery range remains intact |
| 81,754.45 | October 8 UTC daily close | Whether buyers retain the ground recovered since that session |
| 80,393.56 | October 8 UTC daily low | The earlier downside extreme if the rebound fails |
The October 8 high is about 0.4% above the latest Bitcoin snapshot. The October 8 close is approximately 1.7% below it. Those distances describe today’s positioning; they are not forecast returns or recommended entry and exit orders.
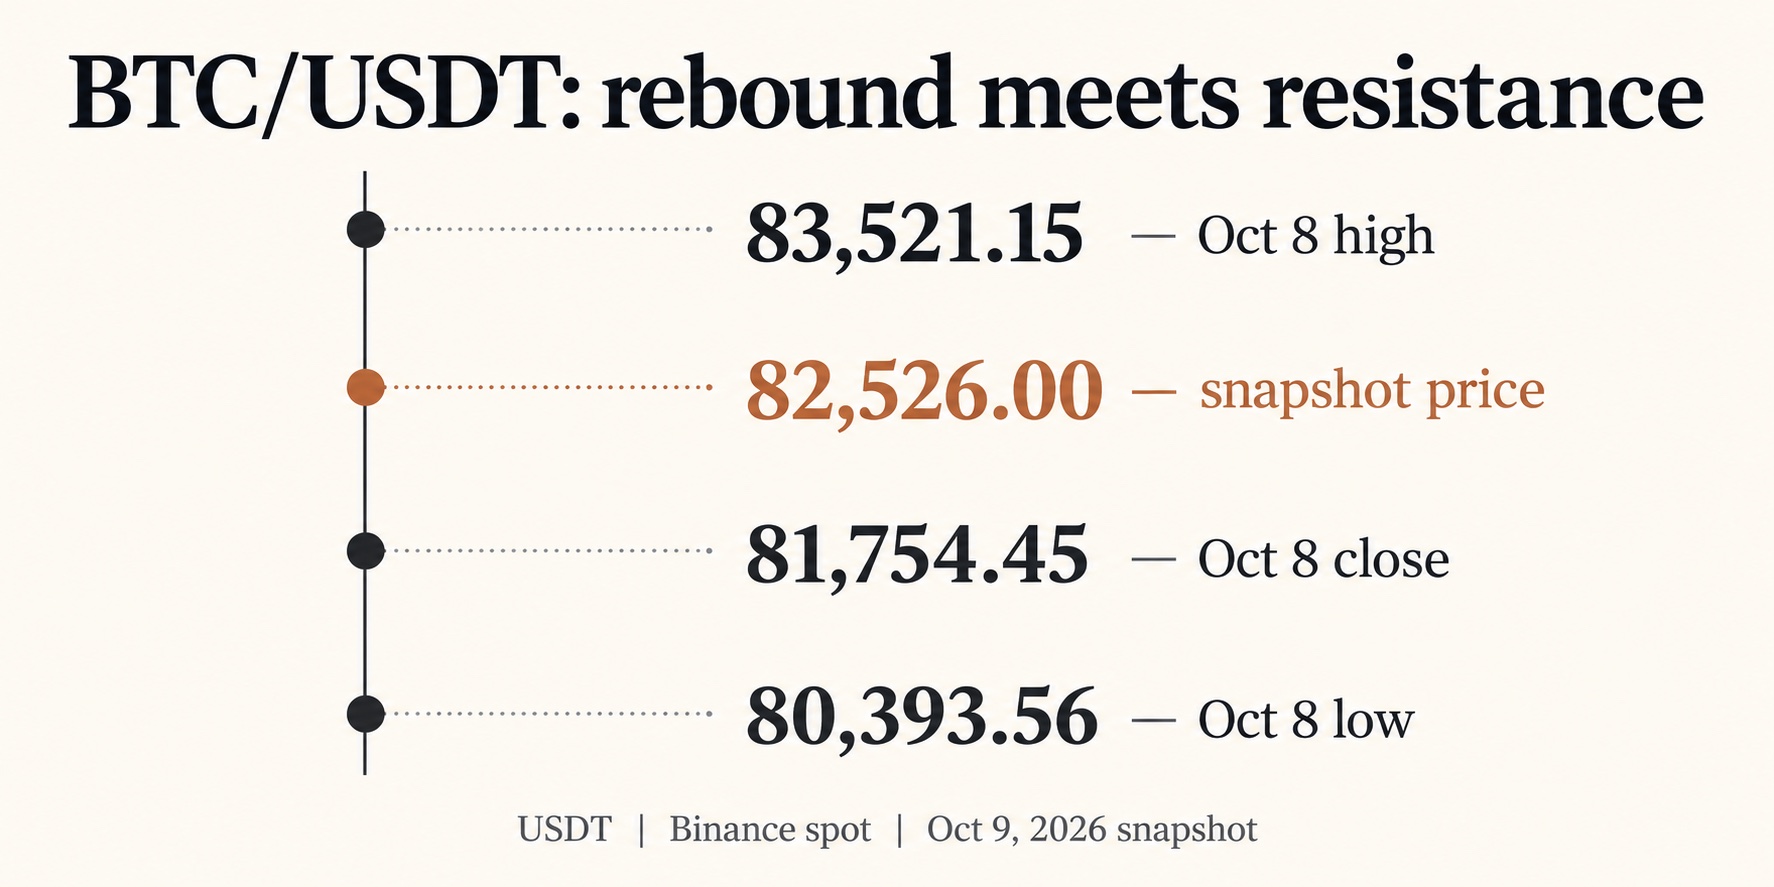
AI-generated reference graphic using the earlier October 9, approximately 07:11 UTC snapshot. Its 82,526.00 price is historical context, not the latest quote. The current research snapshot is 83,167.50 USDT.
A break above a line becomes more informative when price stays above it through subsequent trading. A brief excursion followed by an immediate return below the level can simply reveal that sellers are still willing to offer there. Conversely, holding a previous close while repeatedly testing higher prices would strengthen the recovery case.
These are conditional scenarios. No independently verified current order-book concentration, funding series, or liquidation map is included in this research. I am therefore not calling an exact short squeeze, identifying a hidden whale bid, or attaching certainty to a single price level.
Put execution costs beside the price levels
If you choose to trade this range, position size and execution costs deserve the same attention as the chart. A limit order can control the price you are willing to pay, but it may not fill; a market order prioritizes execution and can incur slippage. A limit order that immediately crosses the book may still be a taker order.
Register on Binance with referral code RATE20 →
The link includes RATE20. Review the referral benefit displayed during registration, your regional eligibility, and the applicable fee schedule before completing signup. Our guide explains the advertised offer: Get 20% off with code RATE20.
Does the wider crypto market confirm the recovery?
The latest spot comparison shows improving large-cap prices, but it does not by itself establish a market-wide trend reversal. CoinGecko’s global API snapshot puts total crypto capitalization near $2.816 trillion. Its official global cryptocurrency charts are the readable destination for the broader market series.
A global capitalization estimate and one exchange’s rolling ticker are different measurements. They can differ in update time, asset coverage, pricing methodology, and reference window. The exchange table is useful for comparing execution markets; the global series is useful for describing the broader market’s size. Combining them into one perfectly synchronized “market close” would imply precision the research does not have.
ETH slightly outperformed BTC in the latest rolling comparison, while BNB was almost flat and SOL slightly negative. That makes the current picture less defensive than the earlier October 9 observation, when those three pairs were all negative. It is a change between two actual snapshots, not a reconstructed hourly history.
The next useful question is persistence. If altcoins retain gains while Bitcoin reclaims its earlier range, participation would look more convincing. If those gains disappear on the next pullback, a positive weekend ticker will have said little about sustained appetite for risk.
Binance news and whale claims: keep the evidence narrow
The official Binance listing announcements were checked during research. The accessible page included the September 24 notice adding Hyperliquid to several services. That is older product context, not a verified fresh October 11 catalyst, and it should not be used to explain today’s Bitcoin move.
The same discipline applies to whale headlines. Research found reports using different wallet-size cohorts and observation windows. Their totals are not interchangeable, and this article does not adopt an unverified current accumulation figure. A large address may belong to an exchange or custodian; coins moving between addresses do not automatically represent a new buyer acquiring exposure.
For the next U.S. session, my checklist is deliberately short:
- Does Bitcoin hold the most recent recovery range when liquidity returns?
- Does the market reclaim the October 8 high and stay above it?
- Do ETF inflows persist beyond a single modest positive session?
- Do major altcoins retain their participation during Bitcoin pullbacks?
Those observations would help distinguish a recovery that attracts continuing demand from one that mainly reflects relief after selling. The calendar alone cannot settle that question.
Frequently asked questions
What is Bitcoin’s price on October 11, 2026?
The research snapshot is 83,167.50 USDT on Binance BTC/USDT, up 0.444% over 24 hours. It was retrieved on October 11 at approximately 06:53 UTC. The linked trading page displays the current quote, which may differ.
Did Bitcoin ETF inflows reverse the recent outflows?
No: October 9’s $21.1 million inflow offset about 2.9% of the $729 million withdrawn on October 7–8. Across those three sessions, the calculated net result remained a $707.9 million outflow. A positive day improved direction without restoring the withdrawn amount.
What is the next Bitcoin resistance level to watch?
83,521.15 USDT, the October 8 daily high, is the nearby historical reference used here. It sits beyond the latest rolling high of 83,210.01. These candle-based levels are analytical checkpoints, not guaranteed resistance or predictions.
If you decide to open an exchange account, compare the displayed referral terms and trading costs before funding it.
Create your Binance account with RATE20 →
Disclosure: SmallDrift may receive a commission through referral links.
This article is for informational purposes only and does not constitute financial advice. Always do your own research before making investment decisions.
Get 20% Off Binance Trading Fees with RATE20
New to Binance? Open the official signup page with RATE20 already applied for a 20% trading-fee discount. You do not need to copy or type the code. Review the referral details before completing registration.

- Referral code: RATE20, pre-applied by this link
- Fee discount: 20%, shown on the Binance signup screen
- Additional rewards: Check Binance for current promotions and regional availability
Be wary of unofficial referral offers promising benefits they cannot show. The Binance signup screen lets you check the code and fee discount directly.
Compare Binance fees and available discounts →
SmallDrift may earn a commission when you sign up through this link. Trading involves risk, including loss of capital.
Related Articles



Explore Related Guides
Daily Crypto Market News
Follow Bitcoin price moves, major altcoins, and the events shaping the market.
Bitcoin ETF Flows Guide
Understand ETF inflows and outflows, and how to read them alongside price action.
Binance Fee Calculator
Learn how to estimate trading costs with referral and BNB discounts.
Verified Binance Referral Guide
See how RATE20 is applied and what to check on the Binance signup screen.