Bitcoin Fades Despite $525M ETF Inflows: October 22, 2026
Bitcoin trades near its rolling low despite renewed ETF inflows. A snapshot of BTC support, weaker altcoins, and the demand test ahead.

Bitcoin is just 0.074% above its rolling 24-hour low, even after U.S. spot ETFs drew roughly $525 million in fresh net inflows. Institutional demand improved, but BTC/USDT at 82,525.95 has surrendered almost all the distance from its latest range floor to its high. The question for October 22 is whether buyers can turn that demand into a price recovery before the floor gives way.
Research cutoff: 2026-10-22 07:04:21 UTC. Binance spot ticker responses were retrieved at 07:01:11–07:01:12 UTC on October 22, 2026. Their rolling windows run approximately from October 21 at 07:01:11 UTC to October 22 at 07:01:11 UTC. USDT quotes are not an independent U.S. dollar benchmark. ETF figures cover completed, dated U.S. sessions. Linked market pages show current data; this article records the snapshot available at research time, and those pages may subsequently display different prices or revised figures.
What is the crypto market doing on October 22?
The sampled major coins are all lower, with Solana showing the largest rolling decline. The official Binance market overview provides a readable live reference. These figures come from separately saved ticker responses for four spot pairs, retrieved within a second of one another.
| Binance spot pair | Last price, USDT | Rolling 24h change | Rolling low–high, USDT | Rolling quote turnover |
|---|---|---|---|---|
| BTC/USDT | 82,525.95 | -0.346% | 82,465.00–84,898.00 | 1.763B USDT |
| ETH/USDT | 2,434.66 | -0.259% | 2,429.46–2,526.62 | 854.24M USDT |
| SOL/USDT | 104.67 | -1.292% | 104.45–109.20 | 229.48M USDT |
| BNB/USDT | 738.70 | -0.670% | 738.00–751.86 | 90.91M USDT |
A small negative daily return can conceal an uncomfortable trading position. BTC’s last price sits only 60.95 USDT above the rolling low, compared with 2,372.05 USDT below the high. It is about 2.5% of the way up that range. That is weak placement even though the headline percentage decline looks modest.
The high and low alone do not reveal the sequence of every trade. They cannot establish the exact time of a reversal or prove that one particular news item caused it. What they establish is simpler: at retrieval, buyers had not kept Bitcoin near the stronger end of the observed window.
Turnover deserves similar care. The 1.763 billion USDT figure measures trading activity in BTC/USDT on Binance Spot. It is not global Bitcoin volume, net capital inflow, or ETF buying. Confusing those measures turns an ordinary market table into a very confident accounting error.
ETF demand recovered; price confirmation did not
Farside Investors’ Bitcoin ETF table shows net inflows of $524.8 million for October 21, following $23.2 million on October 20 and $526.7 million on October 19. Those three sessions total $1,074.7 million. Wednesday’s largest contributions were IBIT at $235.0 million and FBTC at $212.7 million.
| U.S. trading session | Spot Bitcoin ETF net flow |
|---|---|
| October 19, 2026 | +$526.7M |
| October 20, 2026 | +$23.2M |
| October 21, 2026 | +$524.8M |
| Three-session sum | +$1,074.7M |
These are dated fund-flow observations, subject to revision. They are not October 22 intraday flows. The table available at cutoff takes precedence here over earlier, incomplete summaries.
My interpretation: renewed fund demand is constructive, but the weak spot snapshot means a bullish conclusion still needs price confirmation. Fund creations and redemptions, underlying execution, and continuous global trading do not share one clock. Positive flows cannot guarantee that every subsequent seller will be absorbed at a higher price.
Where are Bitcoin’s support and resistance levels?
82,465 USDT is the immediate observed downside reference; 84,898 is the rolling upside boundary. These are levels from the captured ticker, not independently validated long-term support and resistance zones. A single rolling extreme is a place to monitor behavior, not evidence of a permanent wall of orders.
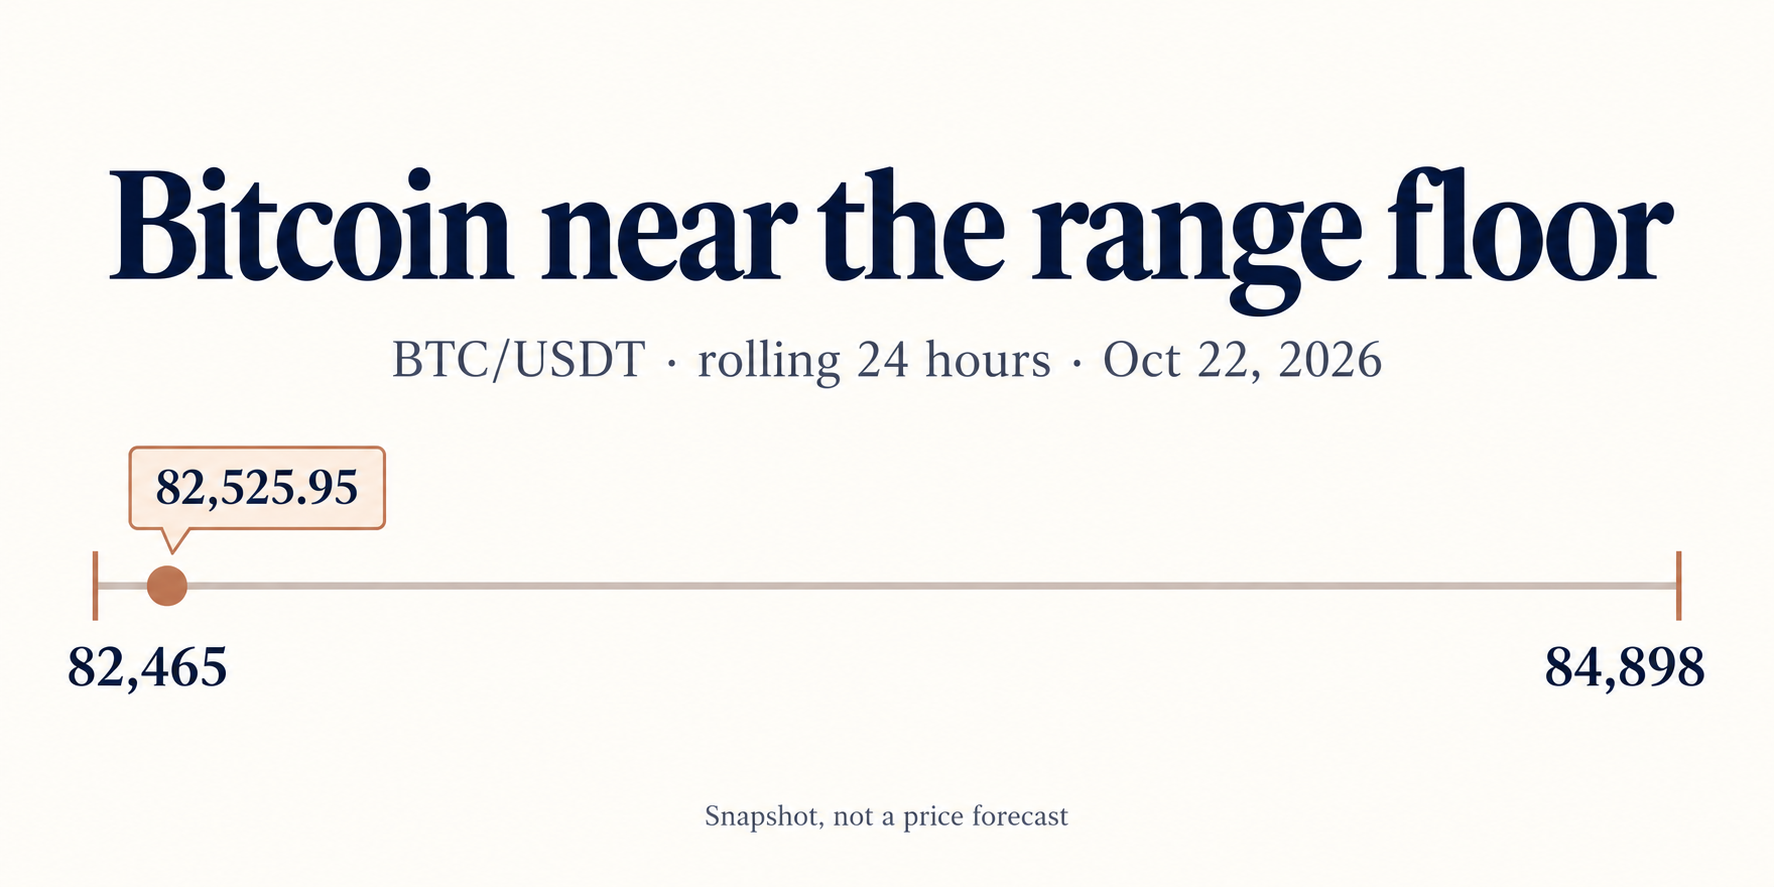
AI-generated snapshot diagram. The table below is the numerical reference; no intraday price path is implied.
| Reference | BTC/USDT level | Why it matters in this snapshot |
|---|---|---|
| Rolling low | 82,465.00 | Nearest observed downside boundary |
| Last price | 82,525.95 | Only 0.074% above the rolling low |
| Rolling volume-weighted average | 83,788.08 | Average execution price weighted by BTC volume in the window |
| Round-number watch level | 84,000.00 | Psychological reference, not measured order-book resistance |
| Rolling high | 84,898.00 | Upper boundary of the captured 24-hour range |
The volume-weighted average is roughly 1.53% above the last price. Reclaiming it would show improvement relative to where trading activity was concentrated in this window. It would not, by itself, establish a new trend. The average moves as new trades enter the window and older trades leave.
A stronger recovery would involve price moving away from the low, trading back toward that average, and holding gains through subsequent activity. A weaker outcome would involve repeated tests below 82,465 without a durable recovery. Neither scenario comes with a probability estimate because these responses do not contain the order book, futures positioning, or a full historical candle series needed to support one.
There is also no defensible next downside target in this dataset once the observed low breaks. Inventing one would make the analysis look more complete while making it less useful.
Altcoins are not providing much reassurance
ETH is relatively resilient in this sample, but all four pairs are near their rolling lows. Ether’s decline is 0.087 percentage points smaller than Bitcoin’s; Solana’s is 0.946 points larger. That suggests uneven risk appetite across these selected markets, rather than a clean rotation into higher-risk assets.
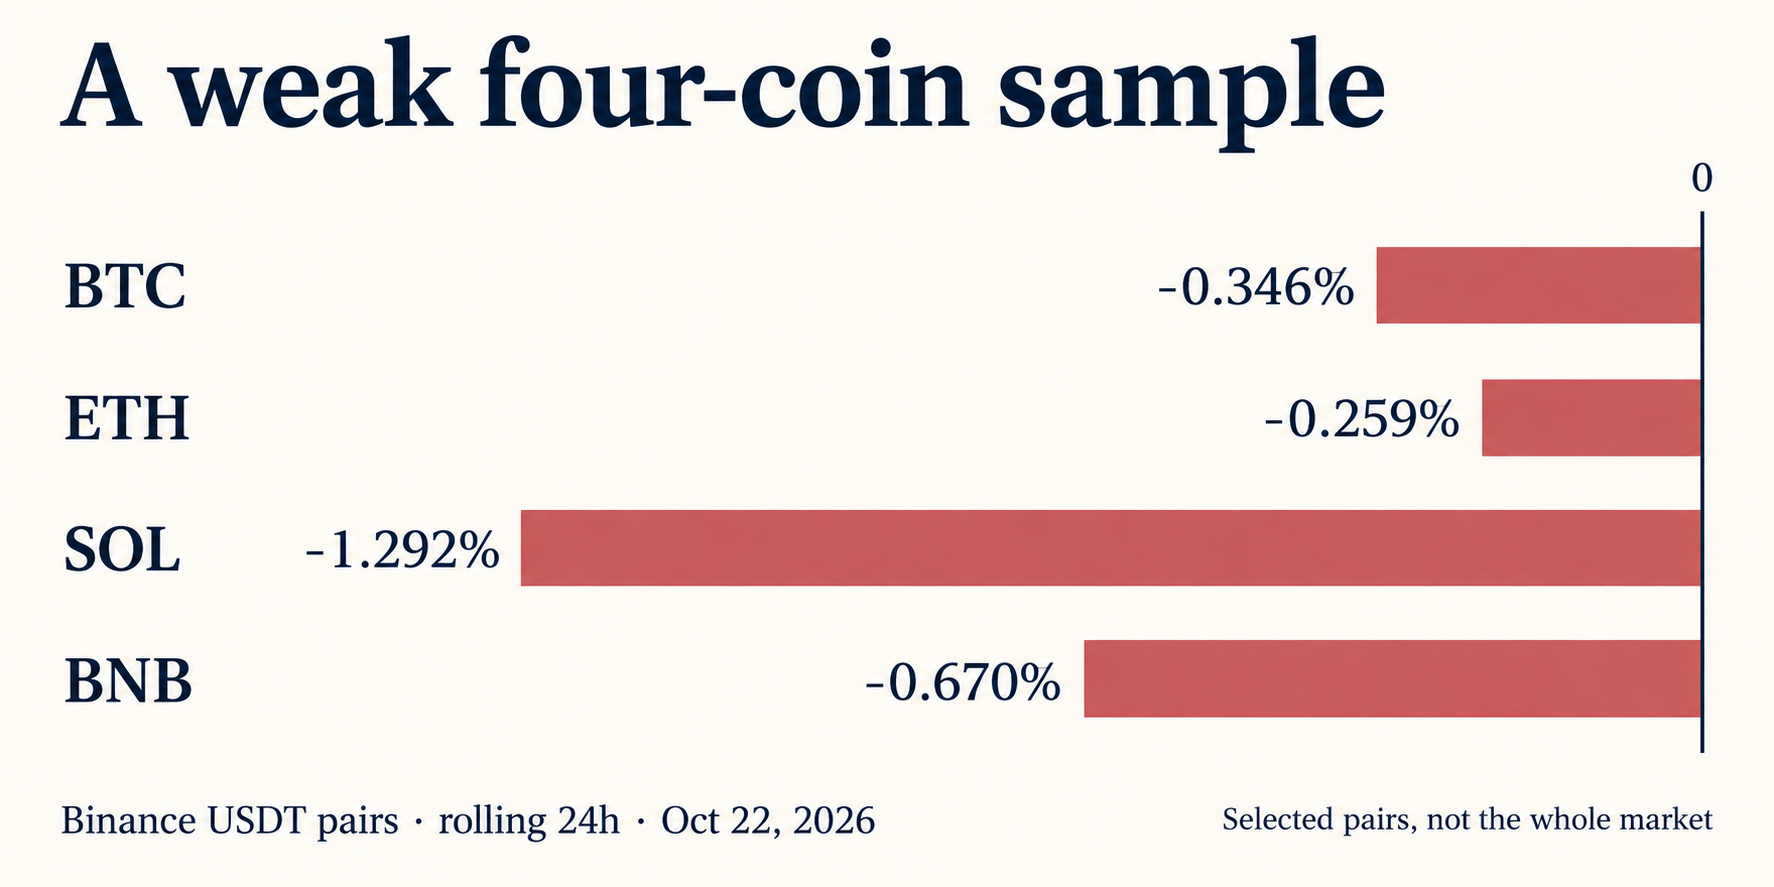
AI-generated comparison using the saved ticker returns. Four selected assets do not measure market-wide breadth.
The difference between relative and absolute performance matters. ETH can outperform BTC over a window while both lose value against USDT. For a holder measuring purchasing power in dollars, a smaller loss remains a loss. For a trader comparing coin strength, it may still be relevant information.
CoinGecko’s saved global response puts total crypto capitalization at about $2.779 trillion, down 2.808% over its reported 24-hour comparison, with approximately $89.91 billion in reported trading volume. BTC dominance is 59.51% and ETH dominance 10.66%. The official CoinGecko global charts are the corresponding reader-facing reference.
The global response carries an update time of 06:59:55 UTC and was retrieved at 07:01:12 UTC. A separately loaded web page may use another refresh or cached snapshot. Its values should not be substituted for the saved response. The global capitalization decline also measures a different universe from four Binance pairs; treating those figures as interchangeable would hide that distinction.
Whale transfers add supply risk, not proof of selling
In his October 21 on-chain analysis, Axel Adler Jr. reports that whales transferred 10,605 BTC to exchanges on October 20, versus a 30-day daily average of 3,815 BTC. He also describes short-term whales’ unrealized profit falling from about $9.8 billion to $4.6 billion over a month.
Those observations suggest potential sell-side inventory and reduced unrealized gains. They do not establish that the transferred coins were sold. Exchange deposits can precede custody changes, collateral use, or trading. Falling paper profits likewise do not prove holders reduced their coin balances.
The useful inference is conditional: if more exchange-available supply meets insufficient spot demand, strong ETF flows may coexist with soft prices. These dated on-chain figures offer context, not a live October 22 measure or a demonstrated explanation for every move in the current range.
Binance’s operational update matters for execution
Binance’s official October 22 tick-size notice scheduled changes to selected USDⓈ-M perpetual contracts at 06:30 UTC today. It says existing orders are unaffected by the update.
This is an execution detail for affected derivatives, not evidence of new demand for Bitcoin. Traders using those contracts should check the applicable price increments before submitting fresh orders. A change to permitted price precision can affect order entry without changing the underlying investment case.
Keep trading costs visible around a narrow floor
A price sitting close to a range boundary can encourage repeated entries and exits. Spread, slippage, and fees can then become meaningful relative to the small move a trader hopes to capture. A limit order controls the worst acceptable execution price, but it may not fill, and a marketable limit order can still incur taker fees.
For eligible readers who have already decided to use Binance, the referral guide explains the signup offer: Get 20% off with code RATE20.
Sign up on Binance with code RATE20 →
The signup link pre-applies RATE20 for the advertised 20% trading-fee discount. Review the displayed referral details, account eligibility, and applicable terms before registering. This is a referral link; SmallDrift may earn a commission. A fee discount does not reduce market risk, and no universal combined fee rate is assumed here.
What would change the market read?
The next useful evidence is a combination of price behavior and fresh demand observations. Another inflow headline on its own cannot answer whether buyers are becoming more aggressive in the continuous spot market.
- Price: Watch whether BTC moves away from 82,465 and can sustain a recovery toward the rolling weighted average.
- Participation: Compare ETH, SOL, and BNB with BTC over genuinely matched windows, rather than mixing exchange snapshots from different hours.
- Fund demand: Check the next completed U.S. session and any revisions to prior totals.
- Supply: Treat large exchange transfers as potential inventory until subsequent evidence supports an actual selling interpretation.
These are observation criteria, not instructions to enter a leveraged trade. A rolling low can move lower, an average can drift, and yesterday’s fund buyers do not owe today’s traders a rescue.
Frequently asked questions
Why is Bitcoin falling despite ETF inflows?
Positive ETF flows do not guarantee a higher spot price in the next trading window. Other supply can outweigh that demand, and ETF session reporting differs from continuous crypto trading. The captured data shows coexistence, not a proven single cause.
What Bitcoin price levels matter on October 22, 2026?
The saved Binance BTC/USDT snapshot identifies 82,465 as the rolling low and 84,898 as the rolling high. Its weighted average is 83,788.08. These are historical snapshot references, not fixed future support or resistance guarantees.
Are altcoins outperforming Bitcoin today?
The answer differs by asset in this sample: ETH lost less, while SOL and BNB lost more. All four sampled Binance USDT pairs were negative over their approximately matched rolling windows. That does not establish the direction of every altcoin.
Create your Binance account with code RATE20 →
Referral code RATE20 is pre-applied. Check the displayed fee-discount terms and local availability before completing registration.
This article is for informational purposes only and does not constitute financial advice. Always do your own research before making investment decisions.
Get 20% Off Binance Trading Fees with RATE20
New to Binance? Open the official signup page with RATE20 already applied for a 20% trading-fee discount. You do not need to copy or type the code. Review the referral details before completing registration.

- Referral code: RATE20, pre-applied by this link
- Fee discount: 20%, shown on the Binance signup screen
- Additional rewards: Check Binance for current promotions and regional availability
Be wary of unofficial referral offers promising benefits they cannot show. The Binance signup screen lets you check the code and fee discount directly.
Compare Binance fees and available discounts →
SmallDrift may earn a commission when you sign up through this link. Trading involves risk, including loss of capital.
Related Articles



Explore Related Guides
Daily Crypto Market News
Follow Bitcoin price moves, major altcoins, and the events shaping the market.
Bitcoin ETF Flows Guide
Understand ETF inflows and outflows, and how to read them alongside price action.
Binance Fee Calculator
Learn how to estimate trading costs with referral and BNB discounts.
Verified Binance Referral Guide
See how RATE20 is applied and what to check on the Binance signup screen.