Bitcoin Falls Despite $527M ETF Buying — October 20, 2026
Bitcoin trades near 81,790 USDT despite renewed ETF inflows. Concentrated IBIT demand and a weak spot range leave the rebound unconfirmed.

Bitcoin is falling even after U.S. spot ETFs attracted roughly $527 million in a single session. BTC/USDT stood at 81,790.01 on Tuesday morning, down 1.303% over its rolling 24-hour window, while Monday’s ETF buying came entirely from one fund. The distinction matters: institutional demand has returned, but the price has yet to show that buyers control the market.
Research cutoff: 2026-10-20T07:03:05 UTC on October 20, 2026. Binance spot responses were retrieved at 07:00:38–07:00:39 UTC; their rolling windows run approximately from October 19 at 07:00:38 UTC to October 20 at 07:00:38 UTC. CoinGecko’s global snapshot was retrieved at 07:00:39 UTC and carries an earlier provider update time. ETF figures cover the completed October 19 U.S. session. Linked market pages show current data, which may differ from these captured figures. Pair prices are USDT; ETF flows and global valuations are U.S. dollars.
What is the crypto market doing today?
Bitcoin, Ethereum and Solana are lower in the captured spot window, while BNB is slightly higher. That is a mixed market with a weak center, rather than evidence of a broad recovery.
The official Binance market overview provides reader-readable prices and market context. Our table uses separate snapshots of the named spot pairs, so its volumes represent those Binance pairs alone, not worldwide turnover.
| Binance spot pair | Last price, USDT | Rolling 24h change | Rolling low–high, USDT | Pair quote volume |
|---|---|---|---|---|
| BTC/USDT | 81,790.01 | -1.303% | 81,200.00–83,158.00 | 993.08 million USDT |
| ETH/USDT | 2,396.83 | -1.410% | 2,372.62–2,446.27 | 417.54 million USDT |
| SOL/USDT | 104.63 | -1.087% | 103.54–106.22 | 193.52 million USDT |
| BNB/USDT | 729.53 | +0.202% | 723.19–733.64 | 69.83 million USDT |
Ethereum’s decline is modestly larger than Bitcoin’s. Solana is holding up slightly better on this particular comparison, but a smaller loss is still a loss. BNB’s green reading is useful evidence of dispersion; it does not establish that capital is rotating into the entire altcoin market.
A four-asset sample cannot measure every sector. It can, however, stop a familiar analytical shortcut: calling isolated resilience an altcoin season before the larger assets have even recovered their starting prices.
The ETF headline is strong. Its breadth is weaker.
According to Farside’s Bitcoin ETF flow table, October 19 produced $526.7 million of net inflows. IBIT brought in $665.2 million, offset by $83.6 million leaving FBTC and $54.9 million leaving GBTC. The other nine listed funds showed zero net flow.
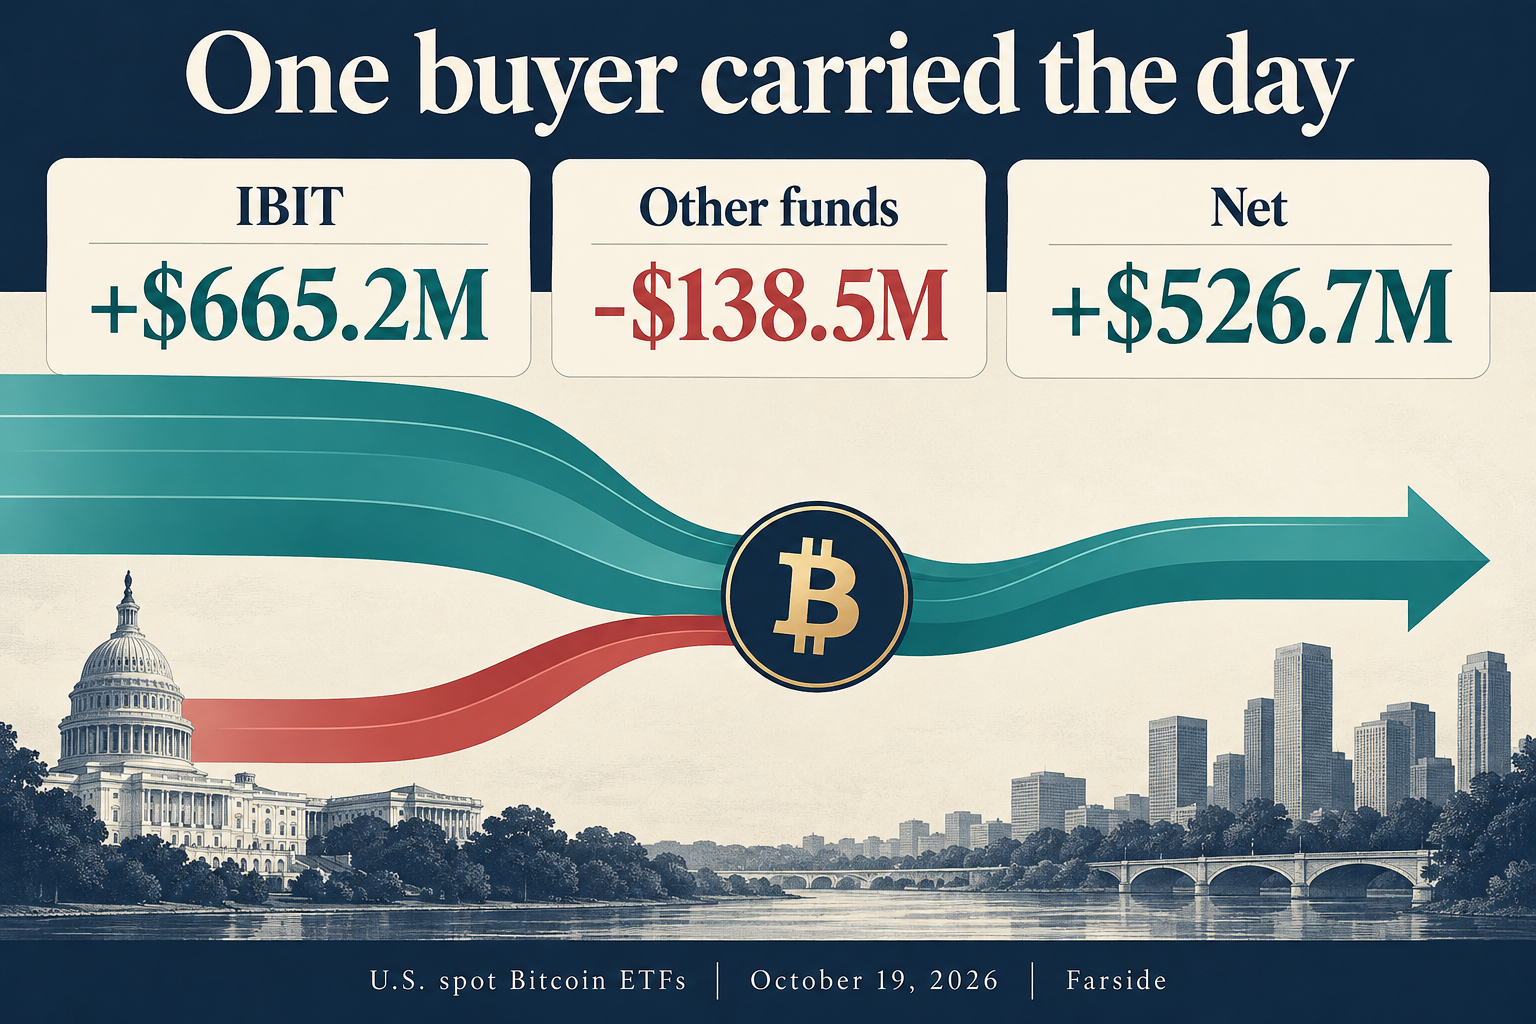
AI-generated explanatory graphic using the captured Farside figures; not a live dashboard.
Those numbers describe a concentrated source of demand. A large buyer can absorb supply and help stabilize price, but the headline does not demonstrate agreement across fund investors. The useful follow-up is whether buying persists and spreads across more products.
There is also a timing problem. A completed U.S. fund session and a continuously moving crypto window are different measurements. Their coexistence does not prove ETF purchases failed, nor that they caused Tuesday’s decline. We do not have the intraday creation and execution records needed to make either claim.
The defensible conclusion is narrower: the published flow improvement has not coincided with a stronger captured spot reading. A fund flow is an input into the market, not a receipt for tomorrow’s return.
Bitcoin’s immediate test is 82,189, then 83,158
The first recovery reference is the rolling volume-weighted average near 82,189 USDT; the observed range ceiling is 83,158. These are snapshot-derived reference levels, not independently established long-term support or resistance.
At 81,790.01, Bitcoin is 590.01 USDT above its rolling low and 1,367.99 below its rolling high. That places it about 30.1% of the way up the observed range. Buyers have lifted price off the bottom, but the snapshot still sits in the lower third.
| Reference | BTC/USDT level | Why it matters | What it cannot establish |
|---|---|---|---|
| Observed rolling low | 81,200.00 | Nearest captured downside boundary | A guaranteed floor |
| Captured last price | 81,790.01 | Location at retrieval | A daily closing price |
| Rolling volume-weighted average | 82,189.09 | Average execution price weighted by volume | A fixed moving average |
| Rolling window open | 82,869.62 | Starting point of the reported change | A universal daily open |
| Observed rolling high | 83,158.00 | Nearest captured upside boundary | A confirmed breakout target |
The weighted average is roughly 0.49% above the snapshot. Reclaiming it would improve the immediate position, but it would only put Bitcoin back above the average traded price in this one window. A stronger recovery would also regain the window open and sustain trading beyond the range high.
Conversely, another test of 81,200 would show that sellers remain willing to challenge the observed floor. Trading below that low would invalidate this particular range framework. It would not justify inventing a precise next support level without additional price history.
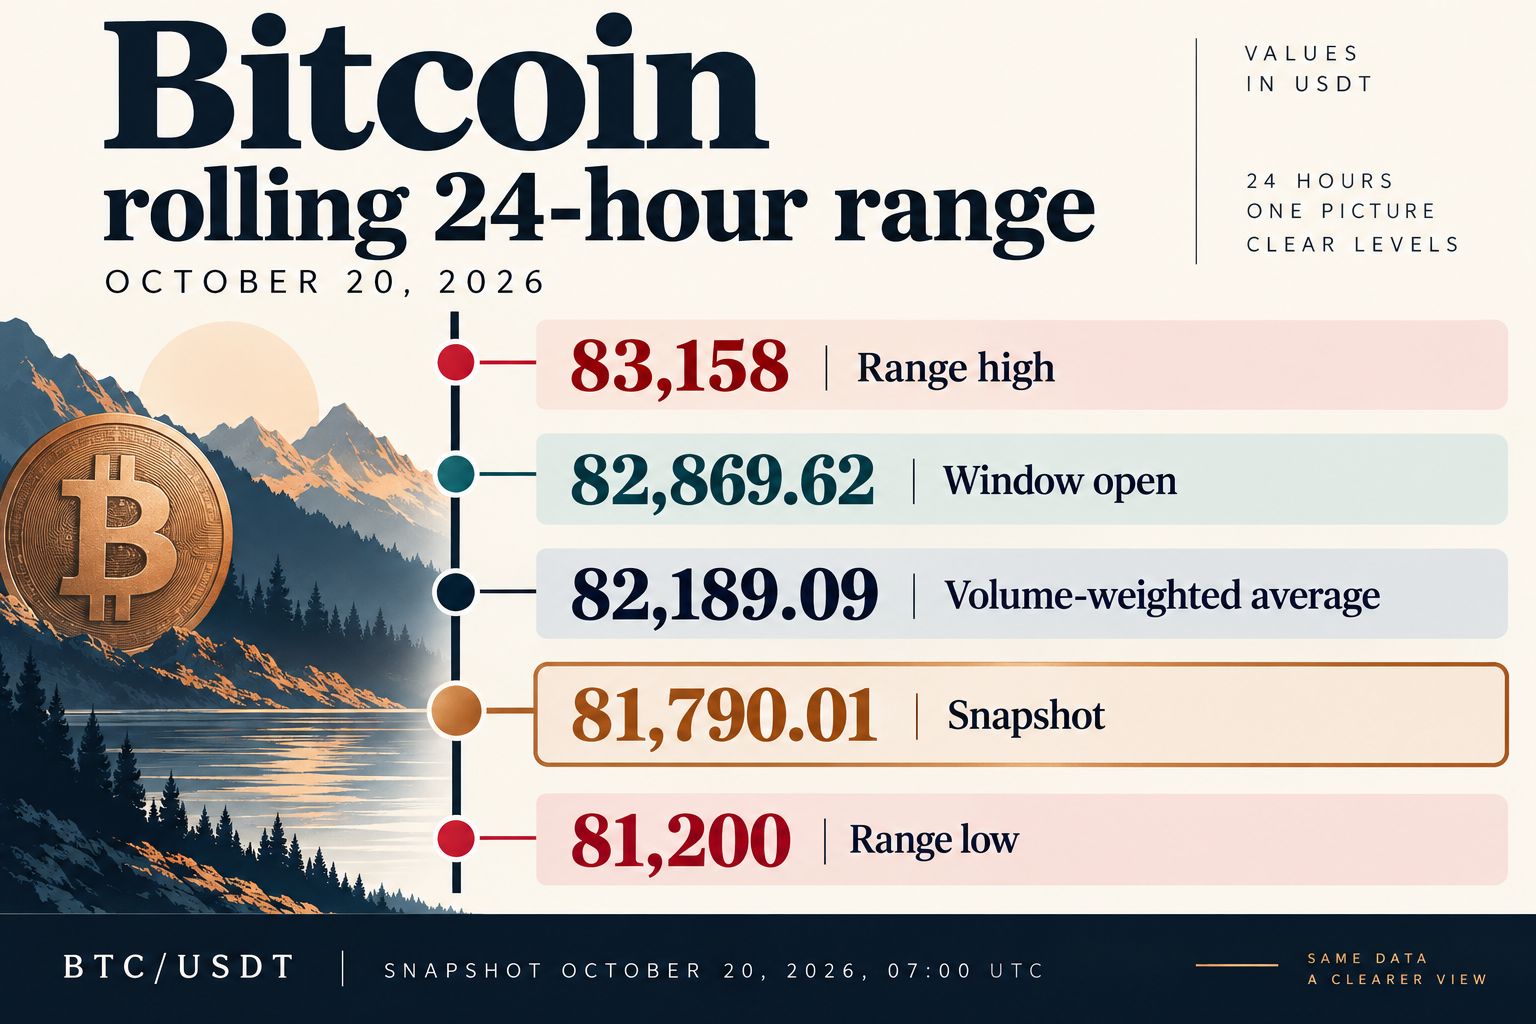
AI-generated reference ladder based on the captured BTC/USDT rolling-window data. It is not a forecast or a historical candle chart.
Three paths to watch
- Recovery: Price regains the weighted average, then the window open, while subsequent completed ETF sessions remain constructive. That would strengthen the case that demand is being absorbed into a healthier market.
- Stalemate: Price remains between the rolling low and weighted average despite positive fund headlines. Supply is still meeting demand, and headline chasing offers little analytical advantage.
- Deterioration: Price loses the observed low and recovery attempts fail. The appropriate response is to reassess the range, rather than keep treating yesterday’s boundary as today’s protection.
These are conditional interpretations, not assigned probabilities. The snapshot provides no basis for a numerical confidence score, a leveraged position size or a guaranteed outcome.
Watch the setup with execution costs in mind
If you choose to trade a range, commissions and spread matter because small price moves leave less room for costs. Eligibility and product access depend on your jurisdiction.
Register on Binance with RATE20 →
The signup link pre-applies RATE20. Review the displayed referral details, any eligible trading-fee discount, and the applicable account terms before completing registration. A referral benefit does not reduce market risk.
For the site’s signup explanation, see Get 20% off with code RATE20. Treat the registration screen’s actual terms as the check on any advertised discount.
Global market weakness is bigger than one Bitcoin candle
CoinGecko’s global market charts provide the broader context. The captured global response puts total crypto capitalization at $2.753 trillion, down 2.856% over its reported 24-hour comparison. Reported volume is $68.923 billion, and Bitcoin’s share of market capitalization is 59.580%.
The global decline is larger than Bitcoin’s named-pair move. Those series have different asset coverage, valuation methods and update times, so the gap should not be interpreted as a precise measure of altcoin losses. It does show why a Bitcoin-only headline can miss weakness elsewhere.
Market capitalization also is not a bank balance. A decline in estimated capitalization does not mean an equal number of dollars physically left exchanges. Prices revalue outstanding supply at the margin; actual cash flows are a different quantity.
Similarly, turnover is not net buying. Every executed trade has a buyer and a seller. Higher activity becomes informative when combined with where price trades and whether rallies hold, rather than when treated as automatic evidence of accumulation.
The practical question is whether participation broadens while Bitcoin repairs its range. Without that combination, a rebound can remain narrow and fragile even when one highly visible demand channel looks better.
Whale narratives need a date attached
Earlier analysis from Glassnode’s “Strength Meets a Wall” report described an early uptrend with limited participation and resistance near 85,500. Its data references late September. That makes it background context, not a fresh October 20 whale reading.
This research did not capture a current, independently verified whale balance series. Consequently, there is no basis here to claim that large holders are accumulating today or to assign a current purchase total to them.
Even a verified transfer to or from an exchange would need interpretation. Custody reorganizations, internal movements and collateral activity can resemble directional positioning. A wallet movement is an observation; the owner’s motive is a separate claim.
Today’s stronger evidence is simpler: captured spot prices, published fund flows and the broader valuation snapshot. They do not answer every question. They do constrain how confident the story should sound.
Binance updates: operational details still matter
The official Binance maintenance announcements list support notices for the Filecoin and IoTeX upgrades scheduled for October 19. These are operational notices, not proof that either token is driving today’s broad market move.
Before transferring an affected asset, check the relevant notice and the live deposit or withdrawal status. Exchange trading, blockchain settlement and wallet maintenance operate on different systems. An available order book does not establish that every transfer route is available.
For this article’s market argument, those notices change the execution checklist rather than the price thesis. We have no verified evidence connecting them to BNB’s small gain or Bitcoin’s decline, and a causal claim would go beyond the research.
Frequently asked questions
Why is Bitcoin down despite ETF inflows?
Positive ETF flows do not guarantee that aggregate buying outweighs selling across every venue and time window. Monday’s completed fund-session data and Tuesday morning’s rolling spot snapshot cover different intervals. The observations show a divergence, but they do not identify a single cause.
What Bitcoin levels matter on October 20, 2026?
The captured range runs from 81,200 to 83,158 USDT, with a volume-weighted average near 82,189. They are useful short-term references for the named Binance spot pair. They will move as the rolling window advances and should not be treated as permanent levels.
Does BNB’s gain mean altcoins are recovering?
One positive token reading is insufficient to establish a broad altcoin recovery. Ethereum and Solana were both lower in the same snapshot collection. Broader participation and sustained relative strength would provide better evidence than one green cell in a table.
The evidence needed next
The next useful confirmation is a combination: price reclaiming its nearby references, subsequent fund demand remaining positive, and more of the market participating. None requires predicting a dramatic breakout before it happens.
Until then, this is a market receiving a sizable but concentrated institutional bid while spot remains under pressure. Keep the time windows separate, the levels conditional and the position of price ahead of the excitement of the headline.
Create a Binance account with RATE20 →
Referral code RATE20 is pre-applied by the signup link. Check the displayed discount and eligibility terms before registering. SmallDrift may receive compensation through this referral link.
This article is for informational purposes only and does not constitute financial advice. Always do your own research before making investment decisions.
Get 20% Off Binance Trading Fees with RATE20
New to Binance? Open the official signup page with RATE20 already applied for a 20% trading-fee discount. You do not need to copy or type the code. Review the referral details before completing registration.
- Referral code: RATE20, pre-applied by this link
- Fee discount: 20%, shown on the Binance signup screen
- Additional rewards: Check Binance for current promotions and regional availability
Be wary of unofficial referral offers promising benefits they cannot show. The Binance signup screen lets you check the code and fee discount directly.
Compare Binance fees and available discounts →
SmallDrift may earn a commission when you sign up through this link. Trading involves risk, including loss of capital.
Related Articles


Explore Related Guides
Daily Crypto Market News
Follow Bitcoin price moves, major altcoins, and the events shaping the market.
Bitcoin ETF Flows Guide
Understand ETF inflows and outflows, and how to read them alongside price action.
Binance Fee Calculator
Learn how to estimate trading costs with referral and BNB discounts.
Verified Binance Referral Guide
See how RATE20 is applied and what to check on the Binance signup screen.