Bitcoin Holds $81,736 After ETF Exits — October 18, 2026
Bitcoin holds its weekend range despite $228.4M in weekly ETF outflows. Watch $79,800 support, $83,466 resistance and weak altcoin breadth.

Bitcoin held $81,736 even after US spot Bitcoin ETFs lost a net $228.4 million over the latest trading week. That resilience comes with an awkward detail: Ether, Solana, XRP and BNB were all lower in the same rolling 24-hour snapshot. The question for October 18 is whether Bitcoin’s stability can broaden into a recovery before the next US trading session tests demand again.
Research cutoff: 2026-10-18 07:02:48 UTC. Prices below are historical research snapshots, not live quotes. Binance BTC/USDT’s rolling window ran from October 17 at 07:00:48 UTC to October 18 at 07:00:48 UTC; the other pairs ended within the following second. Linked market pages show current data, which will differ from these figures. USDT prices are quoted in USDT, not guaranteed US dollars.
What is the crypto market doing today?
Bitcoin is slightly higher, but this five-asset sample shows defensive leadership rather than a broad rally. BTC/USDT rose 0.119% to 81,736.01. The four sampled altcoins fell between 0.235% and 1.143%.
The Binance spot market overview is the reader-facing source for the following exchange-specific snapshot. These are rolling 24-hour returns, not changes since midnight and not consolidated prices across every venue.
| Binance spot pair | Last price, USDT | Rolling 24h change | Rolling 24h quote turnover |
|---|---|---|---|
| BTC/USDT | 81,736.01 | +0.119% | 605.86 million USDT |
| ETH/USDT | 2,412.68 | -0.851% | 326.54 million USDT |
| SOL/USDT | 103.76 | -1.143% | 110.39 million USDT |
| BNB/USDT | 720.77 | -0.235% | 51.86 million USDT |
| XRP/USDT | 1.2970 | -1.007% | 59.91 million USDT |
Bitcoin’s positive return deserves attention. It does not establish fresh accumulation by any particular investor group. A ticker measures executed prices and volume; it does not reveal whether buyers are funds, retail traders, market makers or an exchange moving its own inventory.
There is also a denominator problem in every claim that “crypto is up.” One green benchmark can conceal losses elsewhere. Here, only one of five selected pairs was positive. That is a narrow observation about major assets, not a claim that only 20% of the entire crypto market advanced.
Solana lagged Bitcoin by roughly 1.26 percentage points, while Ether lagged by about 0.97 points. If you are considering an altcoin position because Bitcoin looks steady, that relative weakness is part of the trade. Bitcoin can hold its floor while a higher-volatility asset keeps looking for one.
Bitcoin’s range is intact, but recovery has a higher hurdle
The immediate rolling range is 80,819.66–82,078 USDT; the wider seven-day range is 79,800–84,352. Neither boundary is a promise that buyers or sellers will appear there again.
From the captured BTC/USDT spot market data, Bitcoin sat about 0.42% below its rolling high and 1.12% above its rolling low. It was trading in the upper part of that window, which is more constructive than clinging to the bottom. But the price remained below the average close of the previous 20 completed UTC daily candles.
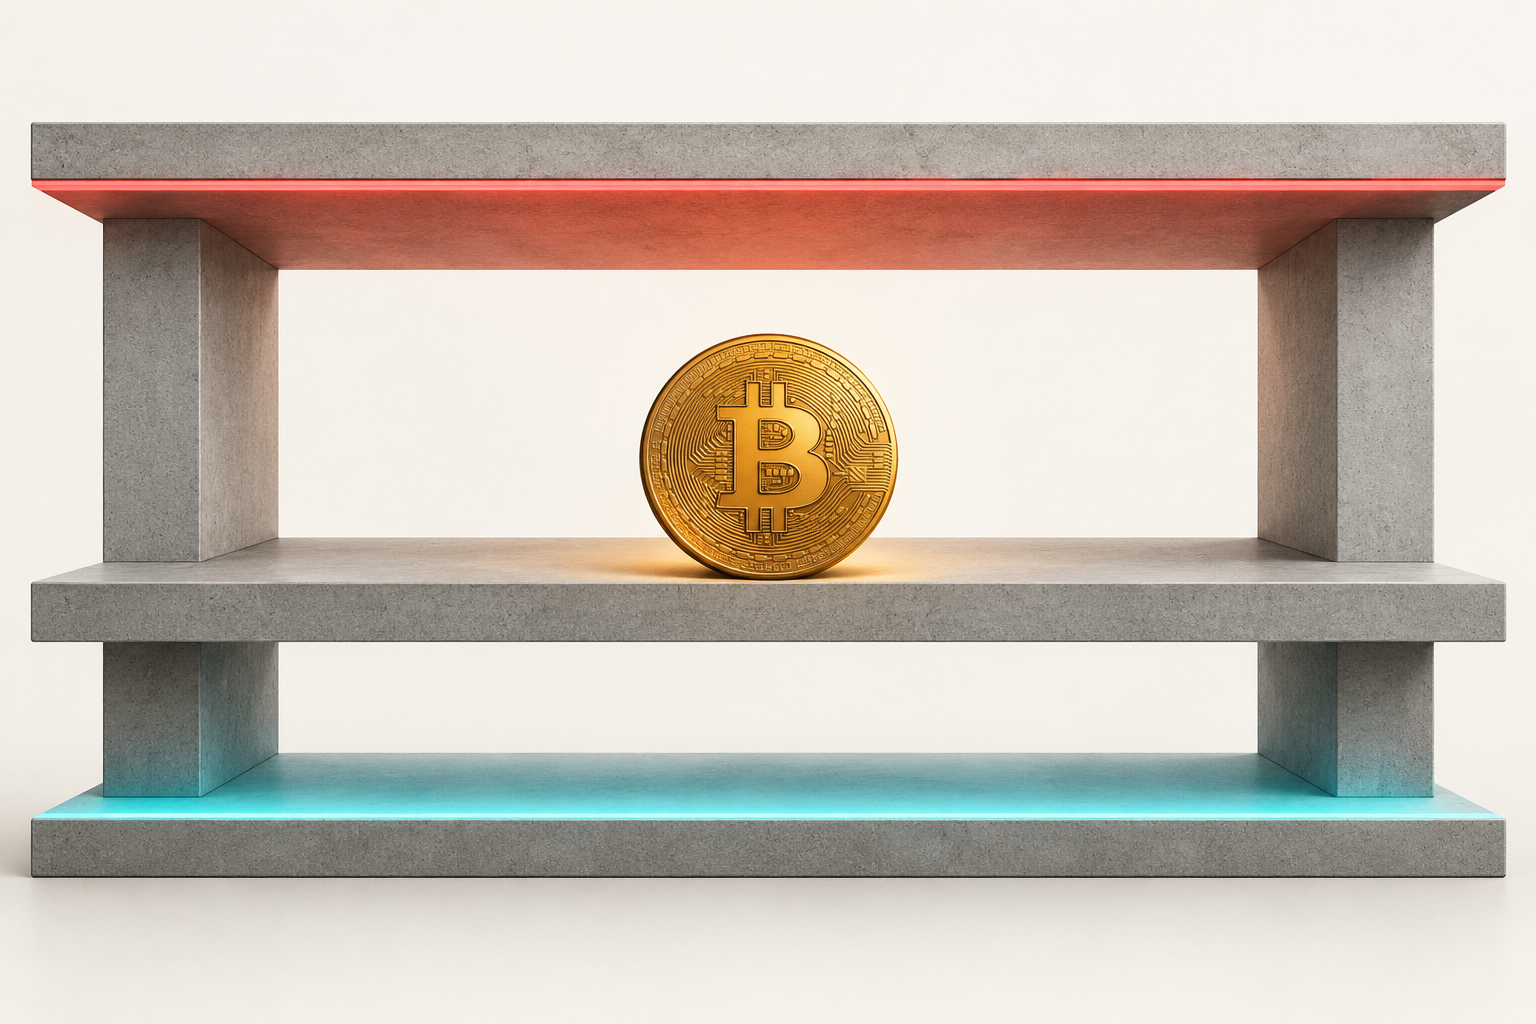
AI-generated conceptual illustration; the table contains the measured levels.
| Reference | BTC/USDT level | What it measures |
|---|---|---|
| Rolling 24h low | 80,819.66 | Lowest trade in the ticker window |
| Rolling 24h high | 82,078.00 | Highest trade in the ticker window |
| Seven-day low | 79,800.00 | Lowest low across October 11–17 UTC candles |
| 20-day average close | 83,465.63 | Simple average of September 28–October 17 daily closes |
| Seven-day high | 84,352.00 | Highest high across October 11–17 UTC candles |
The current October 18 candle is excluded from the daily calculations because it was unfinished. Mixing a partial session into a completed-day average makes comparisons less useful, particularly when the partial candle covers only a few hours.
The distance to the 20-day average was about 2.12%. Reclaiming the rolling high would therefore be an initial improvement, while a recovery toward 83,466 would face a separate test. Clearing one doorstep does not mean you own the building.
My interpretation is conditional: holding above 80,820 preserves the local range; sustained trading above 82,078 improves the immediate setup; acceptance above the average and then the seven-day high would provide stronger evidence of recovery. A brief wick through any level supplies less information than repeated trading and closes beyond it.
Conversely, losing the rolling low would bring the seven-day low back into focus. This dataset does not justify inventing a precise downside target below 79,800. When the evidence ends, the price ladder should end with it.
ETF outflows are a headwind, not a Sunday sell order
Farside’s Bitcoin ETF table shows net outflows of $82.4 million on Friday, October 16. Adding its five daily totals for October 12–16 produces a $228.4 million weekly net outflow.
| US trading date | Net spot Bitcoin ETF flow |
|---|---|
| October 12 | -$65.4 million |
| October 13 | +$175.7 million |
| October 14 | -$261.4 million |
| October 15 | +$5.1 million |
| October 16 | -$82.4 million |
| Week total, calculated | -$228.4 million |
The week contained two positive sessions, but Wednesday’s withdrawal outweighed Tuesday’s inflow. Friday ended negative as well. That leaves a weak institutional-flow backdrop even though spot Bitcoin was holding up in Sunday’s snapshot.
Sunday has no regular US ETF trading session. There is no October 18 daily flow figure here, and Friday’s reading should not be described as money leaving funds “today.” The next published session can change the assessment; it cannot retroactively change this week’s arithmetic.

AI-generated illustration of the tension between spot resilience and ETF outflows; channel sizes do not encode values.
A flow total also differs from a fund’s change in assets under management, which moves with Bitcoin’s price. Neither measure identifies every trade in the underlying market. Treating ETF flows as a complete demand ledger overstates what the table can tell you.
The useful question for the next session is whether negative flows continue while spot support weakens. That combination would be more concerning than either signal alone. Improving flows alongside stronger breadth would offer a better recovery case than a solitary green Bitcoin candle.
Keep execution costs visible
A tight range can tempt traders into repeated entries. Before placing an order, compare the spread, expected slippage and total round-trip fees with the distance to your invalidation level. A small quoted move can leave little room after costs.
If Binance is available in your jurisdiction and fits your needs, register with referral code RATE20. The link pre-applies the code; verify the displayed referral benefit and eligibility before completing registration. This is a referral link and may compensate SmallDrift.
For the site’s explanation of the offer, see Get 20% off with code RATE20. Available discounts depend on the applicable product and account terms. A referral does not improve the underlying trade setup.
Binance’s mining change matters for operations
Separately, The Block reports that Binance will close its mining pool and related services on November 10 at 07:00 UTC. The report includes Pool Savings, Cloud Mining and Transaction Accelerator in the closure.
Affected users should review their product instructions and move mining operations ahead of the cutoff. This is an operational deadline, not evidence that Bitcoin’s network will stop producing blocks or that spot trading is closing.
For today’s price analysis, the announcement is background. The research does not establish that it caused BNB’s 0.235% decline, Bitcoin’s resilience or any specific order flow. News happening in the same week is not enough to prove a causal connection.
That distinction matters because exchange headlines often get repackaged into market explanations without a transmission mechanism. A service closure directly affects its users. A claim about the price impact requires additional evidence about selling, demand or liquidity that is absent here.
Three conditions to watch next
The next useful update should resolve three separate questions:
- Does Bitcoin retain its local floor? Watch the captured 80,820 area, then the completed seven-day low near 79,800. Refresh these references as new candles complete.
- Does breadth improve? Ether and Solana participating in a recovery would be more persuasive than Bitcoin rising alone. Compare returns over matching windows.
- Do ETF flows stabilize? Wait for the next reported US session rather than filling the weekend gap with assumptions.
These observations describe market conditions; they are not automatic buy or sell instructions. A trader with a short holding period may care about the rolling boundaries, while a longer-term investor may care more about repeated daily closes and several sessions of flows.
Position sizing should follow the amount you can lose if the setup fails. A nearby chart level can still be crossed rapidly, and a stop order can execute away from its trigger during a fast move. Leverage magnifies that gap between a neat plan and an actual fill.
There is no independently verified whale transaction total in this research. Large wallet transfers can represent custody changes, internal exchange movements or collateral management. Calling them purchases without transaction-level evidence would make the story more exciting and less reliable.
The same restraint applies to market-wide aggregates. An inconsistent aggregate API response was excluded rather than blended with another provider’s current page. The captured exchange data is sufficient to describe this setup without manufacturing agreement between incompatible snapshots.
Frequently asked questions
What is Bitcoin’s price on October 18, 2026?
The captured Binance BTC/USDT last price was 81,736.01 at approximately 07:00:48 UTC. It was up 0.119% over that ticker’s rolling 24-hour window. Current market pages will show later prices.
What are Bitcoin’s key support and resistance levels today?
The captured rolling low and high were 80,819.66 and 82,078; completed seven-day extremes were 79,800 and 84,352. The 20-day average close was 83,465.63. These are historical reference levels, not guaranteed reversal points.
Did Bitcoin ETFs have outflows today?
There is no regular Sunday US ETF session; the latest reported session was Friday’s $82.4 million net outflow. The five-session total for October 12–16 was a calculated $228.4 million net outflow.
Bitcoin’s stability gives buyers something to defend. Weak breadth and negative weekly ETF flows leave them something to prove. The stronger recovery case needs participation and follow-through, not just a price that has stopped falling for a few hours.
Create a Binance account with RATE20 if you have independently decided the platform suits you. Review the referral terms shown at signup before proceeding.
This article is for informational purposes only and does not constitute financial advice. Always do your own research before making investment decisions.
Get 20% Off Binance Trading Fees with RATE20
New to Binance? Open the official signup page with RATE20 already applied for a 20% trading-fee discount. You do not need to copy or type the code. Review the referral details before completing registration.

- Referral code: RATE20, pre-applied by this link
- Fee discount: 20%, shown on the Binance signup screen
- Additional rewards: Check Binance for current promotions and regional availability
Be wary of unofficial referral offers promising benefits they cannot show. The Binance signup screen lets you check the code and fee discount directly.
Compare Binance fees and available discounts →
SmallDrift may earn a commission when you sign up through this link. Trading involves risk, including loss of capital.
Related Articles


Explore Related Guides
Daily Crypto Market News
Follow Bitcoin price moves, major altcoins, and the events shaping the market.
Bitcoin ETF Flows Guide
Understand ETF inflows and outflows, and how to read them alongside price action.
Binance Fee Calculator
Learn how to estimate trading costs with referral and BNB discounts.
Verified Binance Referral Guide
See how RATE20 is applied and what to check on the Binance signup screen.