Bitcoin's $83K Ceiling After ETF Inflows — October 21, 2026
Bitcoin rebounds to 82,812.85 USDT as ETF demand slows. The rolling high at 83,439 and uneven altcoin strength frame the next test.

Bitcoin is up 1.238%, but it still has not cleared the ceiling of its own rolling 24-hour range. U.S. spot Bitcoin ETFs attracted another $23.2 million on October 20, following Monday’s much larger $526.7 million inflow. For traders watching the rebound, the useful question is whether that demand can carry BTC through 83,439 USDT, rather than simply keep it comfortably above the latest low.
Research cutoff: 07:06:04 UTC on October 21, 2026. Binance spot observations were retrieved at 07:01:18 UTC and cover rolling 24-hour windows from approximately October 20 at 07:01:18 UTC through October 21 at 07:01:18 UTC. Prices are USDT quotes, not an independent USD benchmark. ETF observations refer to dated U.S. trading sessions. Linked market pages show current data; this article preserves the snapshot researched at the cutoff.
What is the crypto market doing today?
The four sampled Binance pairs are higher, with BNB and ETH outperforming Bitcoin over approximately matched windows. The official Binance market overview is the readable live reference for these markets. The figures below come from saved exchange ticker responses, rather than prices copied from an older article.
| Binance spot pair | Last price, USDT | Rolling 24h return | Rolling low–high, USDT | Pair quote turnover, 24h |
|---|---|---|---|---|
| BTC/USDT | 82,812.85 | +1.238% | 81,322.22–83,439.00 | 1.068B USDT |
| ETH/USDT | 2,440.98 | +1.842% | 2,377.60–2,478.00 | 610.36M USDT |
| SOL/USDT | 106.03 | +1.338% | 103.78–108.25 | 209.68M USDT |
| BNB/USDT | 743.68 | +1.968% | 727.00–744.83 | 69.67M USDT |
BTC is about 1.83% above its rolling low and needs roughly another 0.76% to reach the rolling high. It has recovered to about 70.4% of the distance between those endpoints. That is a constructive position within this particular window, but it is not a breakout. A green return tells you where the comparison started; it does not tell you how much overhead supply remains.
The volume column also needs the right denominator. Bitcoin’s 1.068 billion USDT is turnover for one spot pair on one exchange. It is neither global Bitcoin volume nor net money entering the asset. Each executed trade has a buyer and a seller. Turnover measures activity, while price and subsequent follow-through tell you something about which side is more urgent.
ETF demand improved, but the pace changed sharply
The October 19–20 sessions brought a combined $549.9 million of net inflows. Farside Investors’ Bitcoin ETF table showed the following dated totals at research time; the automatically updated table can be revised.
| U.S. session | Net spot Bitcoin ETF flow |
|---|---|
| October 15 | +$5.1M |
| October 16 | -$82.4M |
| October 19 | +$526.7M |
| October 20 | +$23.2M |
| Sum of these four sessions, calculated | +$472.6M |
On October 20, IBIT added $29.9 million and FBTC added $3.6 million, offset by BITB’s $10.3 million withdrawal. Monday’s large positive total therefore did receive a positive follow-up, but a much smaller one. There is a difference between renewed demand and demand accelerating every day.
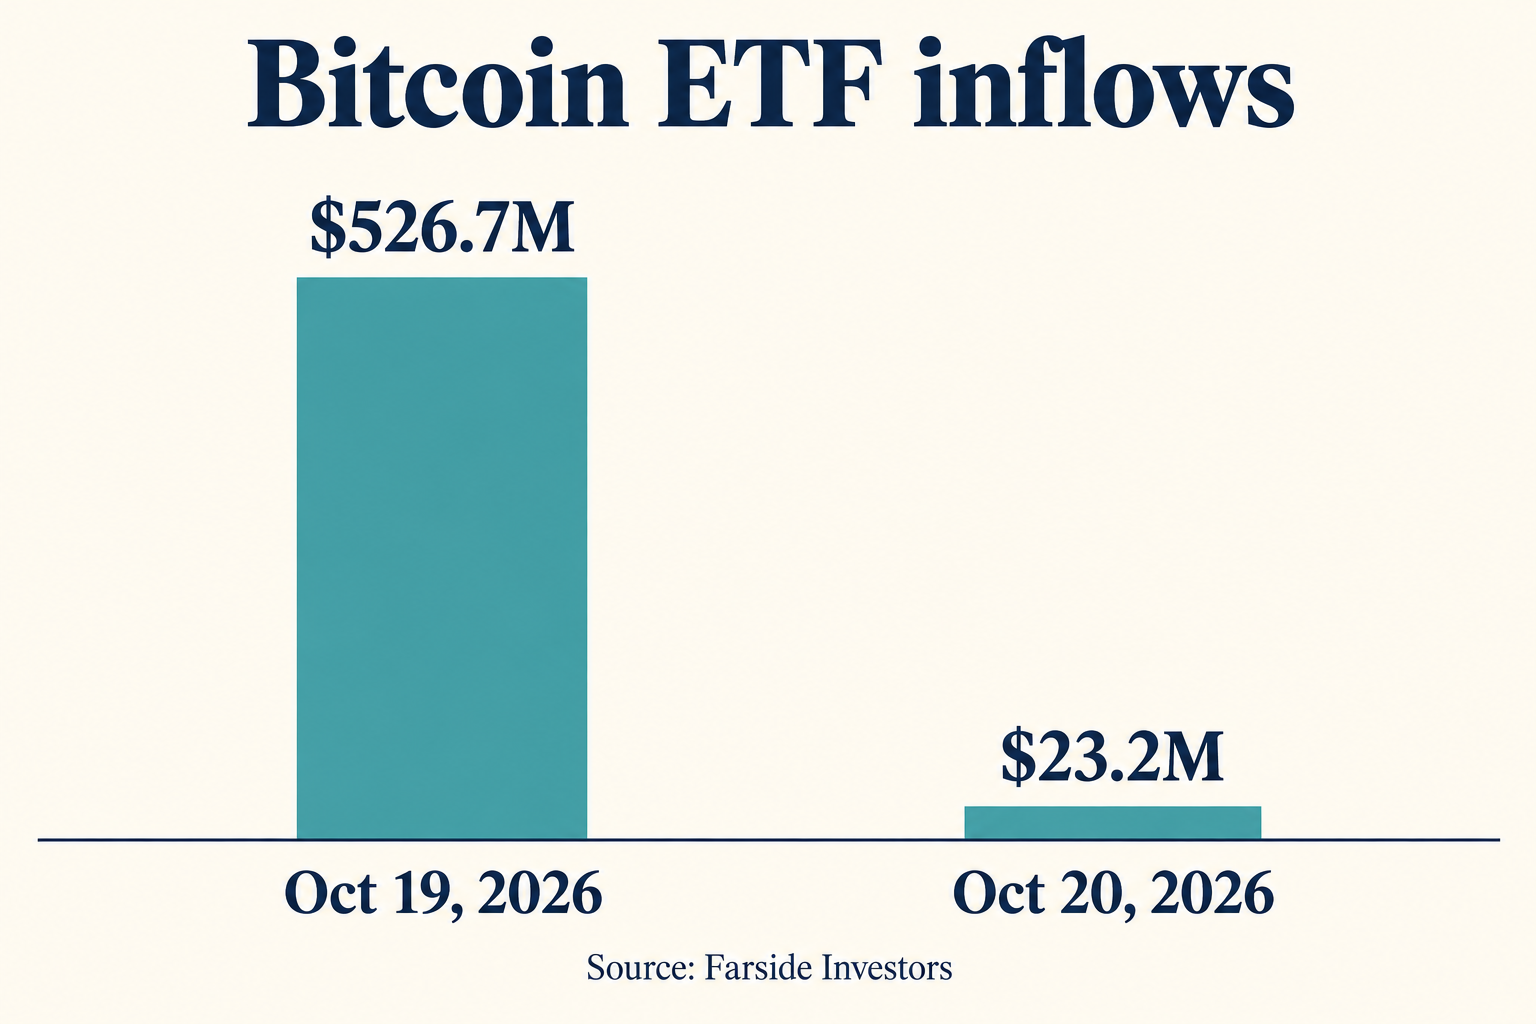
AI-generated comparison using the displayed Farside figures; exact observations are in the table above.
A fund-flow total cannot explain every intraday move in a global market. ETF sessions and Binance’s rolling window use different clocks, and creations or redemptions are distinct from secondary-market share turnover. The reasonable conclusion is that the institutional demand backdrop improved across these sessions. A claim that the inflows guarantee the next breakout would go beyond the evidence.
Which Bitcoin levels matter near $83,000?
The nearest observed ceiling is 83,439 USDT, while 81,322.22 is the rolling low to monitor below. These are exchange observations from the sampled window. The round numbers between them are reference points chosen for scenario analysis, not independently verified support zones or moving averages.
| BTC/USDT reference | Role in this snapshot | What would change the interpretation? |
|---|---|---|
| 83,439.00 | Observed rolling high | Sustained trading above it would strengthen the near-term recovery case |
| 83,000 | Nearby round-number checkpoint | Holding above it would bring the high back into focus |
| 82,812.85 | Snapshot price | Starting point for comparison, not a forecast |
| 82,000 | Round-number downside checkpoint | Losing it would weaken the current rebound within the range |
| 81,322.22 | Observed rolling low | A new low would invalidate this window’s recovery structure |
| 80,000 | Lower psychological reference | Relevant if the rolling low fails; not demonstrated support here |
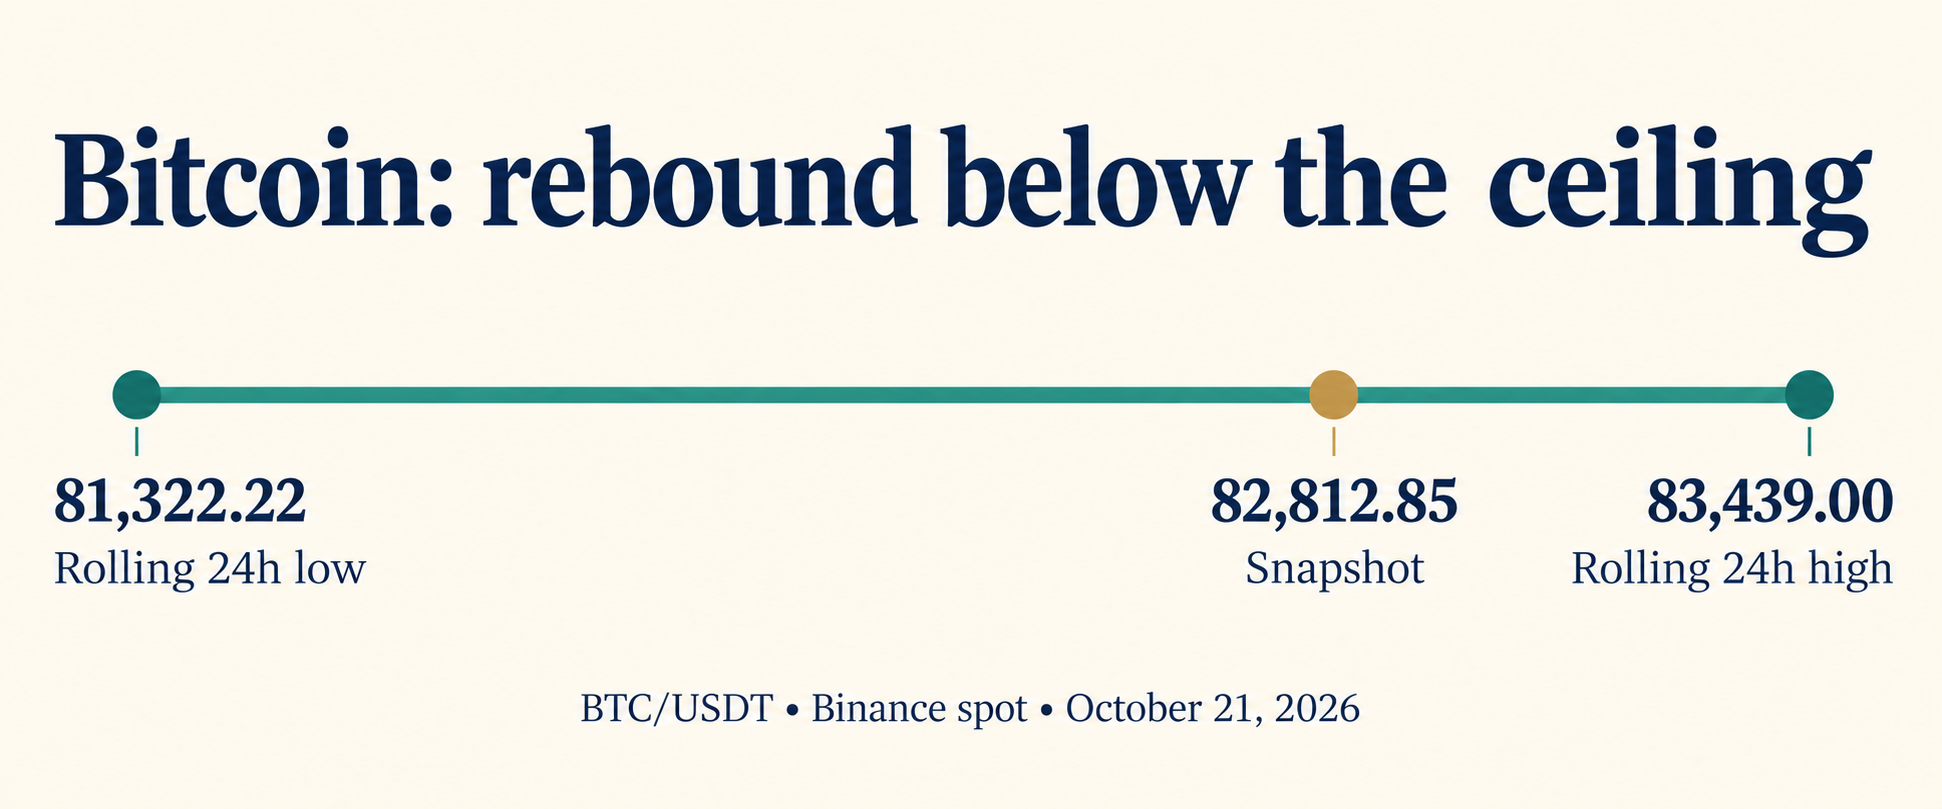
AI-generated range diagram using Binance spot observations, not a historical candlestick chart.
Three paths follow from those references. First, a move above the high that holds on a subsequent retest would provide stronger price confirmation. Second, repeated failures below the high with higher lows could leave the market consolidating. Third, a loss of the rolling low would show that the recovery had failed within this observation window. None of these paths requires a pretend precision price target.
A brief wick through a level is weaker evidence than sustained trading beyond it. Likewise, a fresh high accompanied by deteriorating participation would deserve more skepticism than a move with several major pairs improving together. The levels organize the questions; they do not answer them in advance.
Check execution before chasing the move
If you choose to use Binance for spot execution, compare the live spread and available liquidity with the snapshot above. The signup link below is a referral link, and we may earn a commission.
Sign up on Binance with code RATE20 →
The link pre-applies RATE20. Review the displayed referral rebate, eligible products and regional terms before registering; any advertised 20% trading-fee discount depends on the terms shown to your account. Our guide explains the signup details: Get 20% off with code RATE20.
Are altcoins confirming Bitcoin’s recovery?
ETH and BNB show stronger percentage gains, but their positions inside their own ranges differ. ETH outperforms BTC by 0.604 percentage points, SOL by 0.100 points, and BNB by 0.730 points. This is evidence about four selected liquid pairs, not a comprehensive altcoin breadth index.
BNB is only about 0.15% below its rolling high. ETH remains about 1.52% below its own high, while SOL is about 2.09% below. A similar positive daily return can therefore conceal a different amount of unfinished recovery. SOL being green is useful context; it does not mean SOL is testing resistance as closely as BNB.
The practical cross-check is whether those relationships persist when BTC approaches its high. If ETH and SOL retreat while Bitcoin moves alone, confidence in a broad recovery should be lower. If several sampled pairs challenge their respective highs together, participation looks healthier. That is an observation framework, not a reason to assume every smaller token will follow.
Why global market totals need a separate clock
CoinGecko’s saved global response showed approximately $2.787 trillion in market capitalization and $79.23 billion in 24-hour volume. It reported a 1.323% decline in USD market capitalization over its own 24-hour comparison, alongside Bitcoin dominance of about 59.51%. Its update timestamp was October 21 at 06:56:20 UTC.
The readable CoinGecko market charts returned a different header during this research session: approximately $2.87 trillion and 57.9% BTC dominance. Those displays are not interchangeable with the saved API response. We retain the API figures as a labeled snapshot and disclose the difference rather than manufacture agreement between two retrieval surfaces.
Nor does a decline in aggregate capitalization mechanically contradict four positive exchange-pair returns. The asset universe, source prices and comparison windows differ. This snapshot cannot isolate how much of the difference comes from each factor. It supports caution about the phrase “the whole market is rallying,” which claims considerably more than this sample demonstrates.
Whale balances provide context, not a buy signal
Large-address holdings look mixed across time horizons. Maketo’s large-address balance page, using an October 20 observation, showed 7,175,056 BTC in addresses holding at least 1,000 BTC. That total was up 1,556 BTC over seven days but down 17,692 BTC over 30 days and down 23,166 BTC over 90 days.
Those overlapping windows should not be added together. More importantly, an address is not an investor: custodians and exchanges can hold funds for many customers, and internal transfers can change size classifications. The short-window increase is compatible with improving accumulation, but it does not establish that identifiable whales bought spot Bitcoin or that selling pressure has ended.
The useful confirmation would come from demand and price behavior reinforcing one another. A balance statistic alone cannot tell you whether the next offer at the rolling high will be absorbed.
Today’s Binance development is a campaign, not market demand
Binance Pick’s prediction period starts October 21 and runs through November 15 UTC. The official campaign announcement, published October 19, describes a potential reward pool of up to 1,000,000 USDC, with participation conditions and regional restrictions.
That is relevant platform news, but a maximum promotional pool is not money flowing into Bitcoin. It also is not evidence that the campaign caused BNB’s relative strength. Traders should keep a product announcement, an ETF creation and an executed spot purchase in separate mental buckets. The ticker does not include a field for promotional enthusiasm.
Keep fees separate from the price thesis
A narrow gap to resistance can be consumed quickly by trading friction. Before entering a position, account for the spread, order size, commissions and the cost of exiting if the setup fails. A limit order controls the submitted price, but execution and maker classification depend on how it interacts with the order book.
Referral rebates and paying fees with BNB can affect eligible commissions under current account terms. They should not be treated as universally stackable across every product, and this market snapshot does not verify a blanket effective fee. A cheaper trade can still be a poor trade.
Review Binance registration with referral code RATE20 →
Frequently asked questions
What is Bitcoin’s price on October 21, 2026?
The researched Binance BTC/USDT snapshot was 82,812.85 USDT at approximately 07:01:18 UTC. Its rolling 24-hour return was +1.238%. It is a historical exchange observation; linked market pages display current prices.
Did Bitcoin ETFs see inflows or outflows?
Farside displayed $23.2 million in net inflows for October 20, following $526.7 million on October 19. The two-session total was $549.9 million. No October 21 U.S. session total is asserted at this early UTC cutoff.
What would confirm Bitcoin’s rebound above $83,000?
Sustained trading beyond the observed 83,439 USDT rolling high would strengthen the near-term case. A brief price spike is weaker evidence. Continued ETF demand and broader participation would add context, while a break below 81,322.22 would undermine this window’s recovery.
This article is for informational purposes only and does not constitute financial advice. Always do your own research before making investment decisions.
Get 20% Off Binance Trading Fees with RATE20
New to Binance? Open the official signup page with RATE20 already applied for a 20% trading-fee discount. You do not need to copy or type the code. Review the referral details before completing registration.
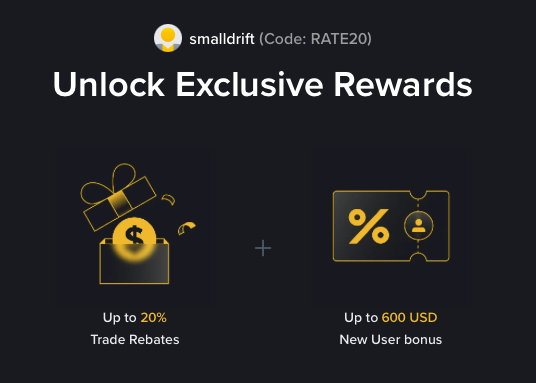
- Referral code: RATE20, pre-applied by this link
- Fee discount: 20%, shown on the Binance signup screen
- Additional rewards: Check Binance for current promotions and regional availability
Be wary of unofficial referral offers promising benefits they cannot show. The Binance signup screen lets you check the code and fee discount directly.
Compare Binance fees and available discounts →
SmallDrift may earn a commission when you sign up through this link. Trading involves risk, including loss of capital.
Related Articles



Explore Related Guides
Daily Crypto Market News
Follow Bitcoin price moves, major altcoins, and the events shaping the market.
Bitcoin ETF Flows Guide
Understand ETF inflows and outflows, and how to read them alongside price action.
Binance Fee Calculator
Learn how to estimate trading costs with referral and BNB discounts.
Verified Binance Referral Guide
See how RATE20 is applied and what to check on the Binance signup screen.