Bitcoin at 83,780: Range or Recovery? — October 13, 2026
Bitcoin recovers within a 3,310 USDT range while major altcoins lag. The October 13 snapshot tests price boundaries, market breadth and dated ETF demand.

Bitcoin is down only 0.489%, yet its rolling 24-hour trading range stretched across 3,310 USDT. At 83,780.22 USDT, BTC has recovered well above the window’s low while major altcoins remain weaker. The useful question on October 13 is whether that recovery can escape the range, or whether a calm headline return is disguising a rough market underneath.
Research cutoff: October 13, 2026, 07:04:11 UTC. Binance spot data was retrieved at 07:01:01 UTC, with exchange-reported rolling windows running approximately October 12, 07:01:03 UTC to October 13, 07:01:03 UTC. Subsecond differences apply across pairs. Quotes are in USDT, which should not be treated as a guaranteed equivalent amount of US dollars.
Linked market pages show current data; this article preserves the snapshot collected before the cutoff. ETF figures refer to dated US trading sessions. Earlier research keeps its original observation dates. The images are AI-generated editorial illustrations and diagrams of the recorded figures, rather than exchange screenshots.
What is Bitcoin doing on October 13?
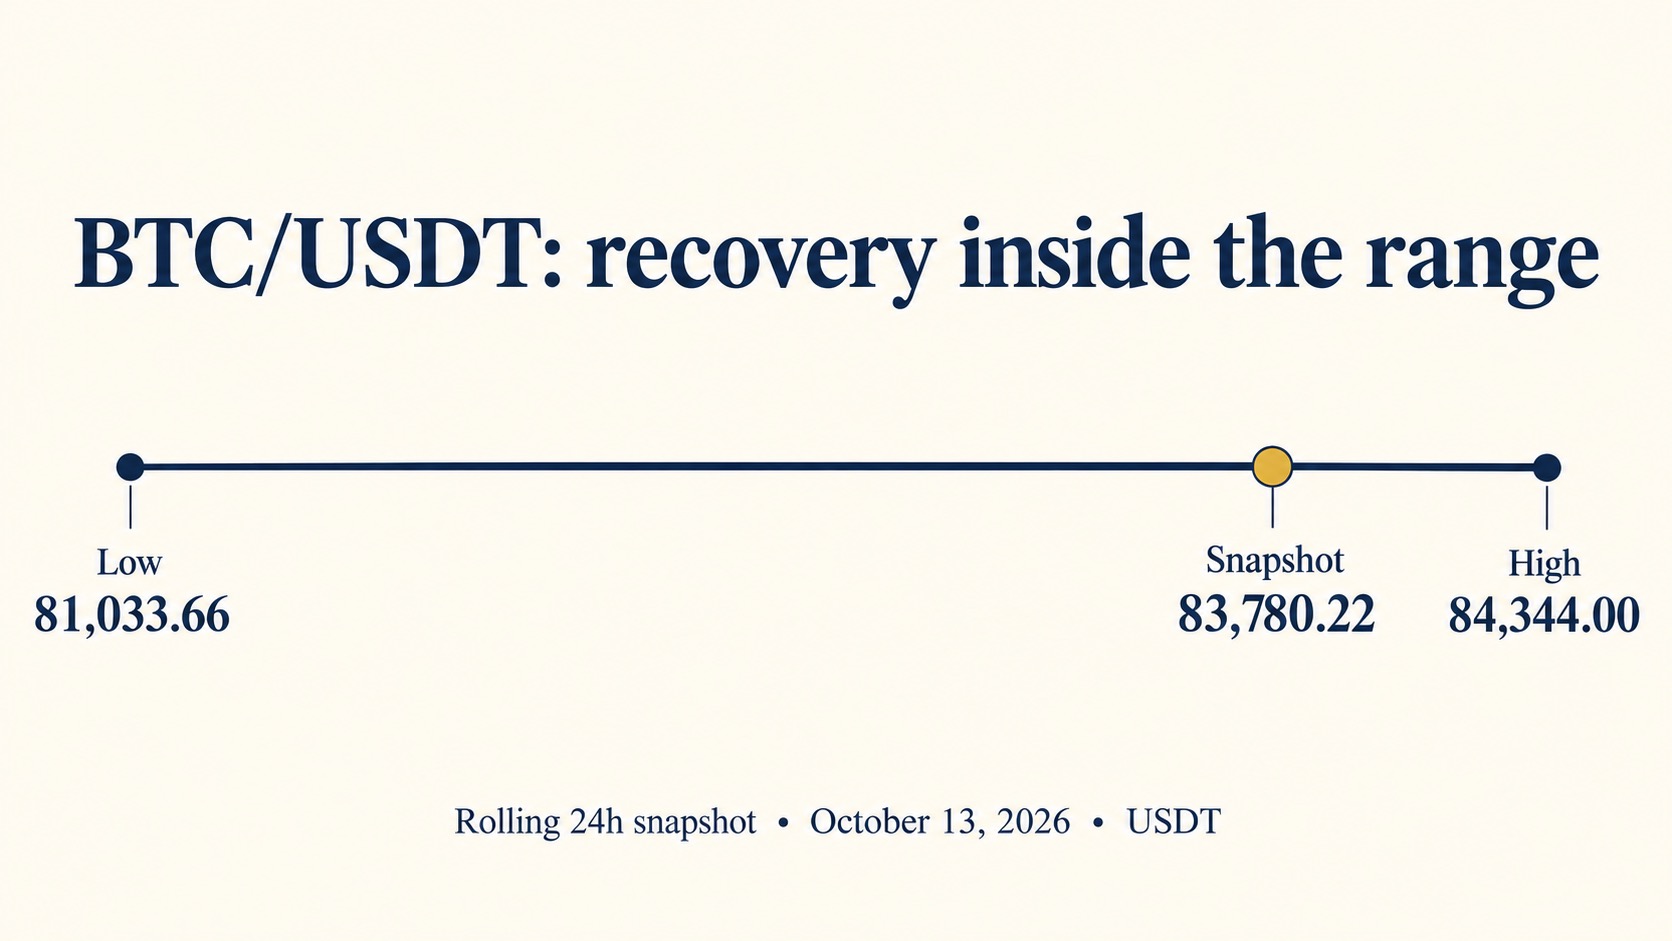
BTC/USDT traded at 83,780.22 USDT after reaching a rolling-window low of 81,033.66 and a high of 84,344.00. The endpoint is 2,746.56 USDT above the low, but still 563.78 below the high. A trader who only sees the percentage change misses much of the movement inside that window.
The official Binance market overview is the readable source page for following these assets. The table below uses individual spot pairs against USDT; the site’s broader asset-volume display can cover a different set of markets.
| Binance spot pair | Snapshot price, USDT | Rolling 24h change | Rolling 24h quote volume |
|---|---|---|---|
| BTC/USDT | 83,780.22 | −0.489% | 1.262 billion USDT |
| ETH/USDT | 2,534.75 | −1.410% | 837.84 million USDT |
| BNB/USDT | 745.95 | −1.210% | 84.29 million USDT |
| XRP/USDT | 1.3775 | −2.568% | 158.75 million USDT |
| SOL/USDT | 108.58 | −3.630% | 292.79 million USDT |
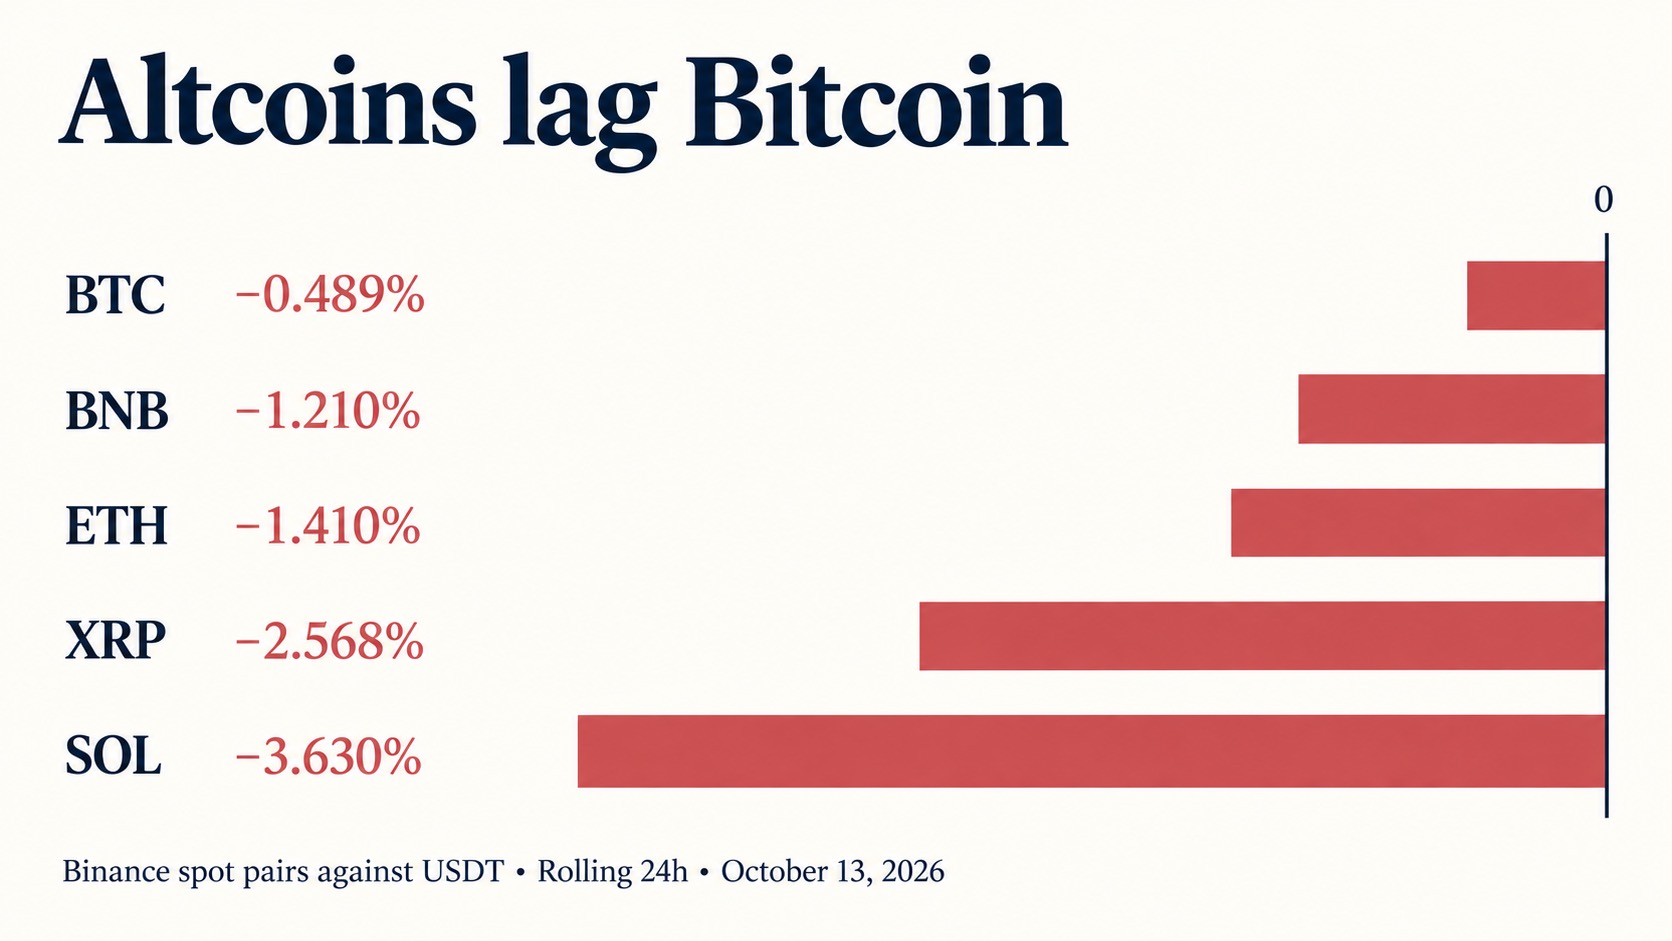
All five pairs are negative. Bitcoin loses the least, while SOL loses the most. That supports a narrow conclusion: these large altcoins are underperforming BTC over this window. It does not establish how every smaller token is trading, or where the next hour’s leadership will come from.
BTC’s high-to-low spread equals about 3.93% of its opening price. That is a range measurement, not the size of the closing loss or a statistical volatility estimate. The latest quote sits approximately 83% of the way from the low to the high. Recovery inside a range is meaningful, but a price near the upper edge still needs to get through that edge.
Which Bitcoin levels matter next?
The immediate references are 84,344 above and 81,033.66 below, because both were actually traded in the captured window. Rounded levels such as 84,000 and 81,000 are useful for organizing a watchlist, but they do not acquire predictive power simply because they are easy to remember.
| BTC/USDT reference | Basis | What to watch |
|---|---|---|
| 84,344.00 | Observed rolling 24h high | Whether a move above it holds on a later retest |
| 84,000 | Rounded observation level | Whether price can stay above it rather than briefly cross it |
| 83,780.22 | Captured last-trade price | Snapshot reference, not a support claim |
| 81,033.66 | Observed rolling 24h low | Whether renewed selling revisits or breaks the window’s low |
| 81,000 | Rounded observation level | Nearby reference if the observed low fails |
These are conditional checkpoints, not automated buy and sell signals. A brief trade above a high can reverse. A break below a low can also recover. What matters is the behavior after the crossing, including whether other major assets participate and whether execution remains orderly.
There is a practical distinction between setting an alert and declaring a breakout. An alert tells you that price reached an area worth examining. A breakout thesis requires evidence that the market can accept higher prices after the initial move. Confusing those two steps is an efficient way to turn a watchlist into a collection of impulse trades.
The snapshot also does not contain a sequence of candles, so it cannot tell us exactly when the high and low occurred or how many times either level was tested. The range graphic deliberately shows three price references without inventing an intraday path. Claims about a double bottom, a moving-average crossover or an RSI divergence would require additional historical observations.
ETF demand still needs a dated reading
The latest displayed US spot Bitcoin ETF row was a 65.4 million dollar net outflow for October 12. Farside Investors’ daily flow table attributed that displayed total to IBIT. This is a dated fund-flow observation, not a live October 13 trading signal; the source is automatically updated and can be revised.
| US trading session | Displayed net flow |
|---|---|
| October 9, 2026 | +21.1 million dollars |
| October 12, 2026 | −65.4 million dollars |
The latest reading does not support a claim that ETF buying has returned consistently. But one negative session does not establish what the next session will do, either. At the cutoff, October 13 US cash trading had not opened. A price move during Asian hours and a previous US session’s fund flows describe different periods.
Treat the table as one demand indicator alongside price. It cannot establish that a particular intraday dip was caused by ETF redemptions, or replace evidence about current spot buying.
Altcoins are the recovery’s weak point
SOL and XRP are falling faster than Bitcoin in the same rolling window. That makes breadth the obvious test for anyone calling the market’s recovery durable. A BTC move higher accompanied by continued weakness in these pairs would be a narrower recovery than a move in which ETH, SOL, XRP and BNB also strengthen.
There are two separate questions here. First, can an altcoin rise against USDT? Second, can it outperform BTC? A token can turn green while still delivering a weaker return than Bitcoin. For a trader choosing between assets, that relative result matters just as much as the color of the price display.
Do not turn one window into a permanent verdict on a network. The data captures current relative performance, not protocol adoption, developer activity or future earnings. It is enough to say that taking additional altcoin exposure currently means accepting a market where the sampled alternatives have been weaker.
A useful follow-up is to compare a later snapshot using the same pairs and the same time-window definition. Mixing a UTC calendar-day return for BTC with a rolling return for SOL can manufacture a rotation that never happened. Consistency is less exciting than a dramatic chart caption, but it makes the comparison usable.
Trading the range starts with execution
If you decide to trade this setup, define the price area and the amount you can lose before placing an order. A recovery from the low can still revisit that low; the observed range makes that possibility concrete.
Create a Binance account with code RATE20 →
The signup link pre-applies RATE20. Check the displayed referral terms and any eligible 20% trading-fee discount before completing registration. Availability and applicable benefits depend on the terms shown for your account and region. SmallDrift may receive referral compensation.
Fees are only one part of execution. A limit order controls the price you are willing to accept, but may not fill. A market order prioritizes execution while accepting the available prices. Neither choice guarantees a better outcome in a fast-moving range. For registration details, see Get 20% off with code RATE20.
What does the wider crypto market show?
CoinGecko’s captured global response put crypto market capitalization at 2.838 trillion dollars, down 2.611% over its reported 24-hour comparison. It recorded approximately 96.10 billion dollars in total trading volume and 59.18% Bitcoin dominance. These are aggregate measures across the provider’s coverage, separate from the Binance pair-specific figures above.
The official CoinGecko global market charts let readers follow those measures. At research time, the readable page displayed different values from the captured response. This article uses the preserved response consistently; it does not splice page figures into the snapshot. Its provider update timestamp was 06:53:28 UTC, before retrieval at 07:01:02 UTC.
The aggregate decline and the sampled altcoin losses point in the same direction: BTC’s relatively small endpoint decline should not be mistaken for an equally mild result across crypto. That is an interpretation of the snapshot, not proof that one group of traders moved capital into another asset.
Dominance is a market-cap share, not a count of buyers. It can increase when other assets fall faster, even without a wave of fresh Bitcoin purchases. Similarly, market capitalization is a valuation measure. A fall in that measure is not an equal amount of cash withdrawn from exchanges.
Older on-chain research remains context
Earlier market-structure research supports caution, but it cannot certify today’s whale positioning. Glassnode’s October 7 report described thin participation, profit-taking by recent holders and stretched altcoin leverage. Its daily on-chain observations ran through October 5, while its hourly order-book and derivatives observations were dated October 7.
The report identified bids around 81,000–81,250 USDT and a recovery checkpoint near 85,500. Those levels provide historical context for today’s range; they do not prove the same orders remain in the book. No fresh, independently verified whale-holdings series was captured for this article. A large transfer alone would not establish buying: custody movements, collateral transfers and internal wallet operations can look dramatic without adding new demand.
Binance’s new headline is separate from BTC demand
Binance’s official listing index displayed an October 13 announcement for RWUSD and a zero-trading-fee promotion. The official new-listing announcements page carried the dated headline. The detail link redirected to the announcement index during verification, so this article does not assert eligible pairs, launch times, promotion duration or product mechanics.
This is exchange-specific news worth checking for users interested in the product. It is not evidence that Bitcoin’s recovery has stronger institutional demand behind it. A product announcement and a market-wide change in capital flows answer different questions.
Frequently asked questions
What is Bitcoin’s price on October 13, 2026?
The captured Binance BTC/USDT price was 83,780.22 USDT. It belongs to the approximately 07:01 UTC snapshot and was down 0.489% over the exchange’s rolling 24-hour window. The linked pages will show later prices as the market changes.
Which Bitcoin support and resistance levels should traders watch?
The observed window’s low was 81,033.66 USDT and its high was 84,344.00 USDT. They are references for monitoring subsequent price behavior, not guaranteed support or resistance. A sustained move beyond either would change the immediate range assessment.
Are altcoins outperforming Bitcoin today?
The four sampled altcoins were all underperforming BTC in the captured window. That finding applies to ETH, BNB, XRP and SOL against USDT, not every token. A stronger recovery would need a later, consistently measured improvement in participation.
For now, the next useful evidence is straightforward: price behavior around the recorded boundaries, broader participation in any rebound and fresh demand observations with clear dates. The market has recovered much of its range. It still has to show what comes after that recovery.
Sign up on Binance with RATE20 →
Referral code RATE20 is pre-applied. Review the displayed eligibility and fee-discount terms before registering.
This article is for informational purposes only and does not constitute financial advice. Always do your own research before making investment decisions.
Get 20% Off Binance Trading Fees with RATE20
New to Binance? Open the official signup page with RATE20 already applied for a 20% trading-fee discount. You do not need to copy or type the code. Review the referral details before completing registration.

- Referral code: RATE20, pre-applied by this link
- Fee discount: 20%, shown on the Binance signup screen
- Additional rewards: Check Binance for current promotions and regional availability
Be wary of unofficial referral offers promising benefits they cannot show. The Binance signup screen lets you check the code and fee discount directly.
Compare Binance fees and available discounts →
SmallDrift may earn a commission when you sign up through this link. Trading involves risk, including loss of capital.
Related Articles


Explore Related Guides
Daily Crypto Market News
Follow Bitcoin price moves, major altcoins, and the events shaping the market.
Bitcoin ETF Flows Guide
Understand ETF inflows and outflows, and how to read them alongside price action.
Binance Fee Calculator
Learn how to estimate trading costs with referral and BNB discounts.
Verified Binance Referral Guide
See how RATE20 is applied and what to check on the Binance signup screen.