Bitcoin's 0.69% Range Hides a Test — October 11, 2026
Bitcoin edges toward its weekend high near 83,210 USDT, but mixed altcoin returns leave the recovery short of broad confirmation.

Bitcoin’s entire rolling 24-hour range is just 0.69%, even as the price inches toward its upper edge. The bounce looks orderly, but Solana and XRP are still negative in the same spot-market snapshot. Before treating a quiet Sunday as the start of a wider recovery, watch whether Bitcoin can escape its local range and bring more of the market with it.
Research cutoff: October 11, 2026, 07:02:00 UTC. Binance spot tickers were retrieved at 07:00:41 UTC; daily candles were retrieved shortly afterward and before the cutoff. Prices below are in USDT, not guaranteed U.S. dollar equivalents. Percentage changes use each pair’s rolling 24-hour window. Linked market pages show current data; this article preserves the research snapshots at the stated retrieval times. The October 11 daily candle is unfinished.
Is Bitcoin’s weekend bounce a breakout?
No: the snapshot shows a move toward a rolling high, with a separate recovery test still above it. BTC/USDT last traded at 83,170.66 USDT, up 0.508% over its rolling 24 hours. Its low was 82,640 and its high was 83,210.01. That is a 570.01-USDT span, or 0.690% of the low.
The official Bitcoin spot market is the reader-facing chart for these exchange-specific figures. A quote near the high says where price sits inside this particular window. It does not tell us whether buyers have repaired the preceding decline.
That distinction matters because a rolling high can move without a new buying surge: an older observation eventually drops out of the window. A completed daily high stays fixed. Using both gives traders a clearer frame than treating every refreshed ticker extreme as a new technical landmark.
Our reading is conditional. Clearing the local ceiling would be a first step; holding above the nearby completed-session highs would offer stronger evidence. Neither event has occurred merely because the quote is green. A market can stop falling before it starts trending upward. Sunday is quite capable of doing the first and leaving the second for someone else.
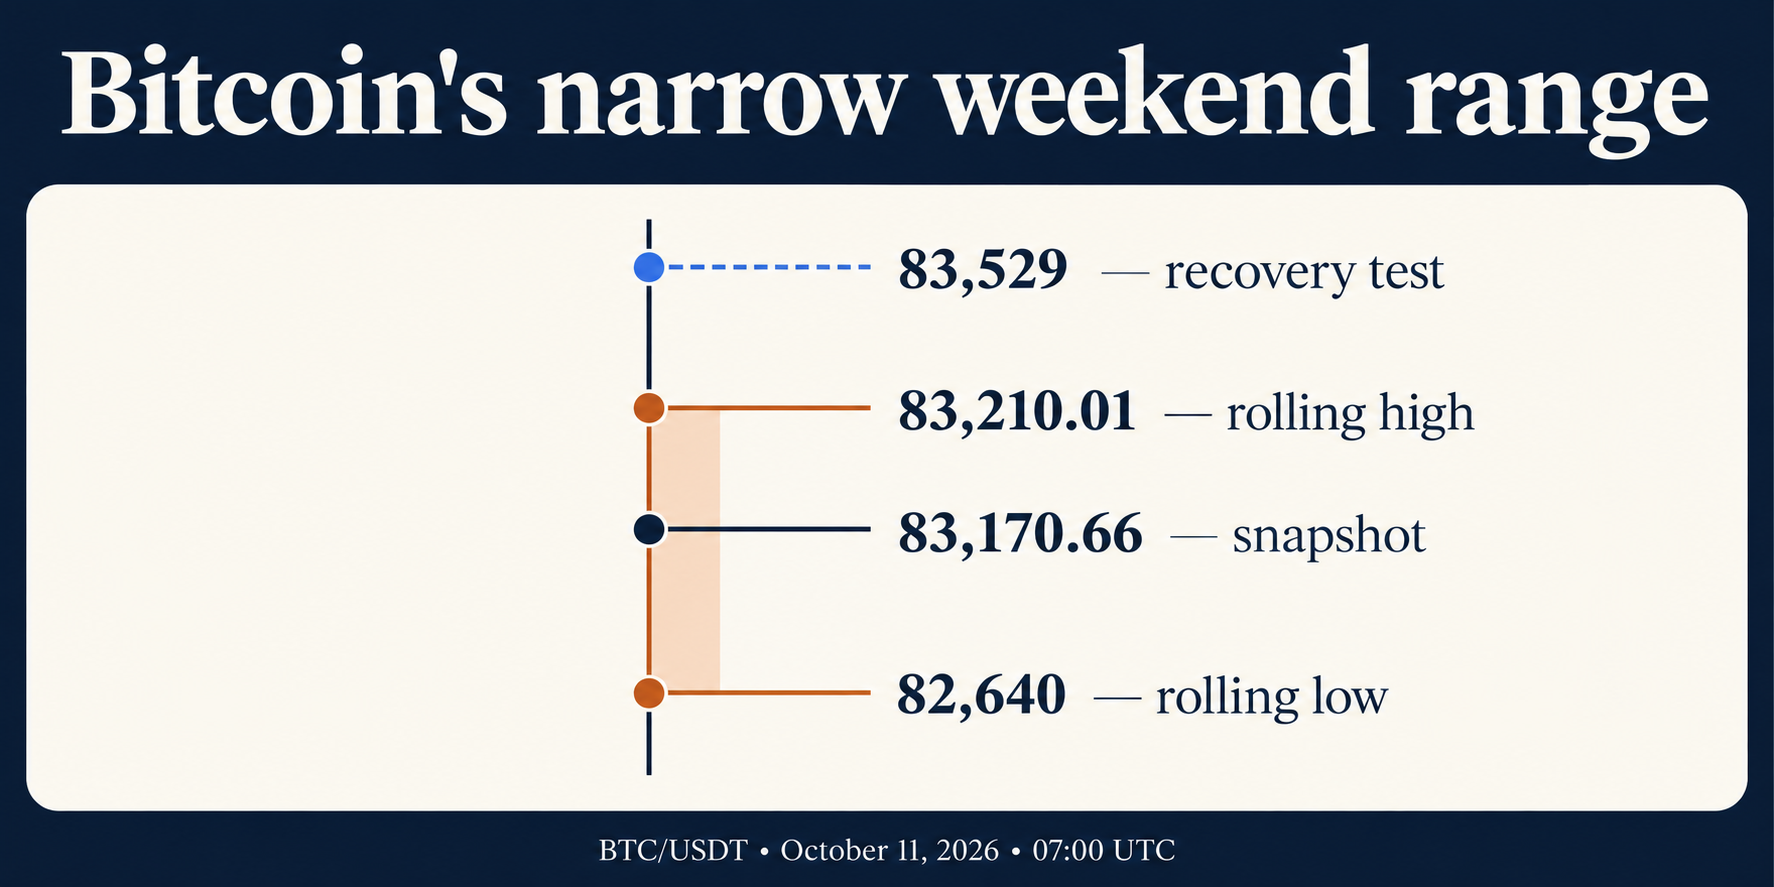
AI-generated explanatory graphic. Values are from the preserved Binance snapshot; the ladder is schematic, not a price forecast or a proportionally scaled chart.
What the major altcoins actually show
The official market overview provides live context. The table uses the saved Binance spot API response, rather than the page’s independently refreshed aggregate quotes. Quote volume is traded notional on the named pair over its rolling window; it is neither global asset volume nor net investment inflow.
| Binance spot pair | Last price, USDT | Rolling 24h change | Rolling 24h quote volume |
|---|---|---|---|
| BTC/USDT | 83,170.66 | +0.508% | 593.38 million USDT |
| ETH/USDT | 2,506.70 | +0.510% | 390.34 million USDT |
| BNB/USDT | 748.82 | +0.072% | 38.70 million USDT |
| SOL/USDT | 109.85 | -0.045% | 96.98 million USDT |
| XRP/USDT | 1.3974 | -0.760% | 44.80 million USDT |
Ethereum roughly matches Bitcoin’s percentage gain. BNB is barely positive, Solana is almost flat, and XRP lags. Three positive pairs out of five offer some participation, but the sample is too small to establish market-wide breadth or an “altcoin season.” These are selected large assets, not a comprehensive index.
The useful question is whether participation expands on the next advance. If several liquid assets turn positive and hold gains while Bitcoin crosses resistance, the recovery has more support than a solitary BTC move. If Bitcoin rises while the others fade, the interpretation is narrower: buyers may be concentrating exposure rather than adding risk across crypto.
Do not confuse this dollar-like quote comparison with performance against Bitcoin. ETH/USDT being green does not automatically mean ETH/BTC is strengthening. To assess rotation, compare like-for-like returns over matching timestamps or inspect the relevant cross pair. These ticker windows end a few seconds apart, so even the apparent two-thousandths-of-a-percentage-point ETH lead should not carry analytical weight.
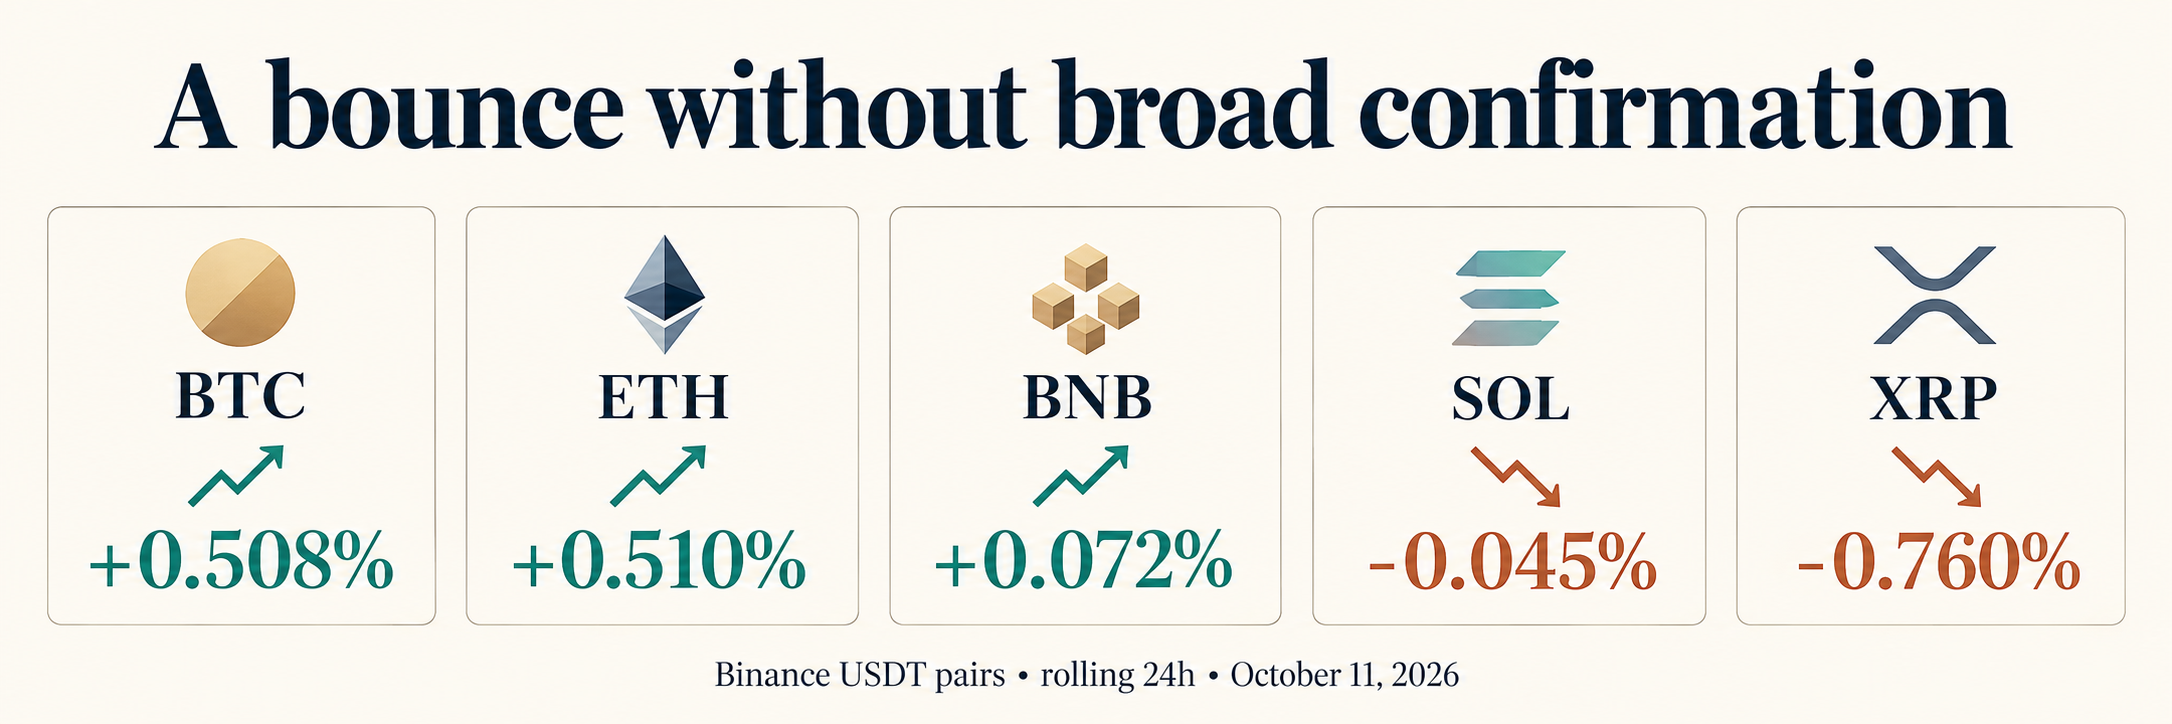
AI-generated illustration of the saved rolling returns. Equal-size cards are labels, not bars scaled to return magnitude.
Separate the local range from the recovery levels
Technical levels below are our interpretation of observed prices, not externally certified support or promises of a reversal. Completed UTC daily candles anchor the higher and lower reference points. Rounding a level creates a zone to monitor, not a magical line that must stop the market.
| Reference, BTC/USDT | Observed level, USDT | How to interpret it |
|---|---|---|
| Rolling 24h low | 82,640.00 | Immediate range floor at retrieval |
| October 10 completed daily low | 82,545.82 | Nearby downside reference outside that floor |
| Rolling 24h high | 83,210.01 | First local ceiling |
| October 8–9 completed daily highs | 83,521.15–83,528.98 | Higher recovery zone, roughly 83,529 |
| October 8 completed daily low | 80,393.56 | Deeper downside reference after a substantial failure |
The two nearby daily highs are useful because they locate previous session extremes above the current quote. They do not prove resting sell orders remain there. A brief trade above that zone could be a wick, a genuine advance, or a failed attempt; the subsequent ability to hold the area determines which interpretation gains credibility.
Below the range, the October 10 low provides another observable reference before the much deeper October 8 extreme. Jumping directly from the first small dip to a dramatic downside target would skip that intervening evidence. Traders should let the sequence unfold rather than compress every possible outcome into one sensational arrow.
The unfinished October 11 candle cannot establish a final daily close. Nor do ten daily candles justify claims about a 200-day moving average, a multi-month trendline, or an RSI reading we have not calculated. The strength of a short observation window is precision about recent structure; its weakness is limited historical context.
Three scenarios for the next move
The central test is acceptance outside the range, followed by participation. There is no probability estimate attached to these scenarios because the saved observations do not support one.
- Recovery: Price moves beyond the local high, then sustains trading above the higher recovery zone. Broader participation would strengthen this interpretation. A single print above resistance is insufficient.
- Continued compression: Repeated probes return inside the range while other large assets remain mixed. That suggests patience rather than a confirmed direction. The boundaries can change as the rolling window advances.
- Failure: Price loses the range floor and cannot recover it, bringing the nearby completed-session low into focus. A deeper reference becomes relevant only if weakness persists through intervening levels.
Decide what would invalidate a trade before entering it. A thesis based on a sustained breakout should not quietly become a long-term investment when the breakout fails. Likewise, a missed move does not make the next entry automatically attractive. Your original opportunity and the price now available are different decisions.
There is also an execution issue. A narrow observed range offers limited gross movement for a short-term strategy. Spread, trading fees and adverse execution can consume a meaningful portion of that movement. Historical range width is not the same as the profit a trader could capture: nobody receives the low and high on demand.
Set up your account before choosing an entry
If Binance is available in your jurisdiction and you choose to use it, review the actual pair, order type and displayed costs before trading. Account registration is separate from this article’s market analysis.
Register on Binance with referral code RATE20 →
The link pre-applies RATE20. Review the displayed referral benefit and eligibility before completing registration. For the site’s explanation of the advertised discount, see Get 20% off with code RATE20.
A lower fee does not validate an entry. Limit orders let you specify a price, but may remain unfilled; a market order prioritizes execution and can fill across available liquidity. Whether an order earns a maker rate depends on how it executes, rather than simply on the word “limit.” Check the order preview and applicable fee schedule.
ETF and exchange news provide context, not confirmation
Farside’s Bitcoin ETF table reports a $21.1 million net inflow for October 9. Across October 5–9, its daily totals sum to a $678.9 million net outflow. Friday improved the direction without reversing the week’s total. October 11 is Sunday, so there is no new regular U.S. ETF trading session to read alongside this weekend quote.
ETF net flows measure fund subscriptions and redemptions. They are not exchange turnover, and the snapshot does not establish how much of any price movement they caused. The next reported U.S. session can add demand evidence, but its total will arrive after trading and may later be revised.
The official Binance announcements also show October 7 additions involving four bStocks trading pairs and collateral assets, followed by October 9 notices including Monitoring Tags for BICO and CVC. These are product and asset-specific developments, not evidence that Bitcoin’s range will break upward. Listing access and collateral eligibility should never be mistaken for an exchange endorsement of expected returns.
Whale narratives deserve the same discipline. Exchange withdrawals alone cannot distinguish new buying from custody changes, internal movements or transfers to another venue. We did not obtain a fresh, reproducible October 11 wallet-cohort dataset, so this article makes no claim about how much whales bought today. A tidy story is not a substitute for an identified time window and measurement.
FAQ
What is Bitcoin’s price on October 11, 2026?
The saved Binance BTC/USDT quote is 83,170.66 USDT at 07:00:41 UTC. It is a historical research snapshot. The linked official trading page shows current data and may display a different price.
What Bitcoin resistance level matters after the weekend high?
The next observed recovery zone is roughly 83,521–83,529 USDT, above the rolling high of 83,210.01. It comes from completed October 8–9 daily highs. These references describe recent structure; they do not guarantee resistance will hold or that a break will continue.
Are altcoins confirming Bitcoin’s recovery?
Confirmation is mixed in the five-pair sample: ETH tracks BTC, BNB is nearly flat, and SOL and XRP are negative. A broader and consistently timed dataset is needed to claim market-wide rotation. Watch whether participation improves if Bitcoin advances beyond its local ceiling.
What to watch next
Watch the sequence: a local escape, sustained trading beyond the higher recovery zone, then wider participation. Check the next completed UTC candle and the next reported U.S. ETF session independently. If the price improves while participation and demand evidence remain weak, keep that tension in the analysis rather than explaining it away.
For anyone preparing an account, create your Binance account using RATE20 → and review the terms shown at signup. This is an affiliate referral link; SmallDrift may receive compensation. The research figures and scenario analysis do not depend on opening an account.
This article is for informational purposes only and does not constitute financial advice. Always do your own research before making investment decisions.
Get 20% Off Binance Trading Fees with RATE20
New to Binance? Open the official signup page with RATE20 already applied for a 20% trading-fee discount. You do not need to copy or type the code. Review the referral details before completing registration.

- Referral code: RATE20, pre-applied by this link
- Fee discount: 20%, shown on the Binance signup screen
- Additional rewards: Check Binance for current promotions and regional availability
Be wary of unofficial referral offers promising benefits they cannot show. The Binance signup screen lets you check the code and fee discount directly.
Compare Binance fees and available discounts →
SmallDrift may earn a commission when you sign up through this link. Trading involves risk, including loss of capital.
Related Articles



Explore Related Guides
Daily Crypto Market News
Follow Bitcoin price moves, major altcoins, and the events shaping the market.
Bitcoin ETF Flows Guide
Understand ETF inflows and outflows, and how to read them alongside price action.
Binance Fee Calculator
Learn how to estimate trading costs with referral and BNB discounts.
Verified Binance Referral Guide
See how RATE20 is applied and what to check on the Binance signup screen.