Bitcoin's $80K Test: What ETF Flows Say — October 25, 2026
Bitcoin holds $80,540 after dipping below $80,000. Friday ETF outflows obscure a positive weekly total, while Ether and Solana lag.

Bitcoin slipped below $80,000 in its rolling 24-hour window, then recovered to $80,540.52. Friday’s Bitcoin ETF outflow looks bearish, but the week’s displayed daily totals still add up to a net inflow. For October 25, the useful question is whether buyers can defend the rebound while Ether and Solana remain weaker.
Research cutoff: October 25, 2026, 07:02:17 UTC. Binance spot snapshots were retrieved at 07:01:02 UTC. Their rolling 24-hour windows run from approximately October 24 at 07:01:02 UTC to October 25 at 07:01:02 UTC. Prices are quoted in USDT, not guaranteed U.S. dollars. CoinGecko’s separate global snapshot was updated at 07:00:58 UTC. ETF figures refer to completed U.S. trading sessions through October 23 and remain subject to reporting updates. Linked market pages show current data; this article records a saved historical snapshot.
What is Bitcoin’s price on October 25?
Bitcoin was $80,540.52 on Binance’s BTC/USDT spot pair, down 0.327% over the measured 24 hours. The recovery from the low matters more than that modest headline decline: price had traded as low as $79,220.74 before returning above the round-number threshold.
The table uses the same exchange, quote currency and rolling window across all three assets. That makes relative performance easier to compare without mixing a dollar composite price with a USDT venue price.
| Binance spot pair | Last price, USDT | Rolling 24h change | Rolling low | Rolling high | Quote volume, USDT |
|---|---|---|---|---|---|
| BTC/USDT | 80,540.52 | -0.327% | 79,220.74 | 81,033.69 | 843.78 million |
| ETH/USDT | 2,343.60 | -1.481% | 2,282.46 | 2,384.28 | 476.33 million |
| SOL/USDT | 101.42 | -0.763% | 98.62 | 102.77 | 154.19 million |
The corresponding official Binance spot market overview is a live reference. Quote volume measures turnover on these particular pairs; it is neither market-wide trading activity nor net capital entering an asset.
Bitcoin’s high-to-low span was $1,812.95, approximately 2.24% of its opening price. By the snapshot, BTC had recovered about 1.67% from the low and stood roughly 0.61% below the high. These are calculations from the saved ticker, not separate observations of when each trade happened.
That limitation is useful. A ticker gives endpoints and extremes, but it does not supply the sequence of every move between them. We can say Bitcoin recovered from its recorded minimum. We cannot turn those four numbers into a detailed intraday chart or claim that buyers repeatedly defended a particular minute.
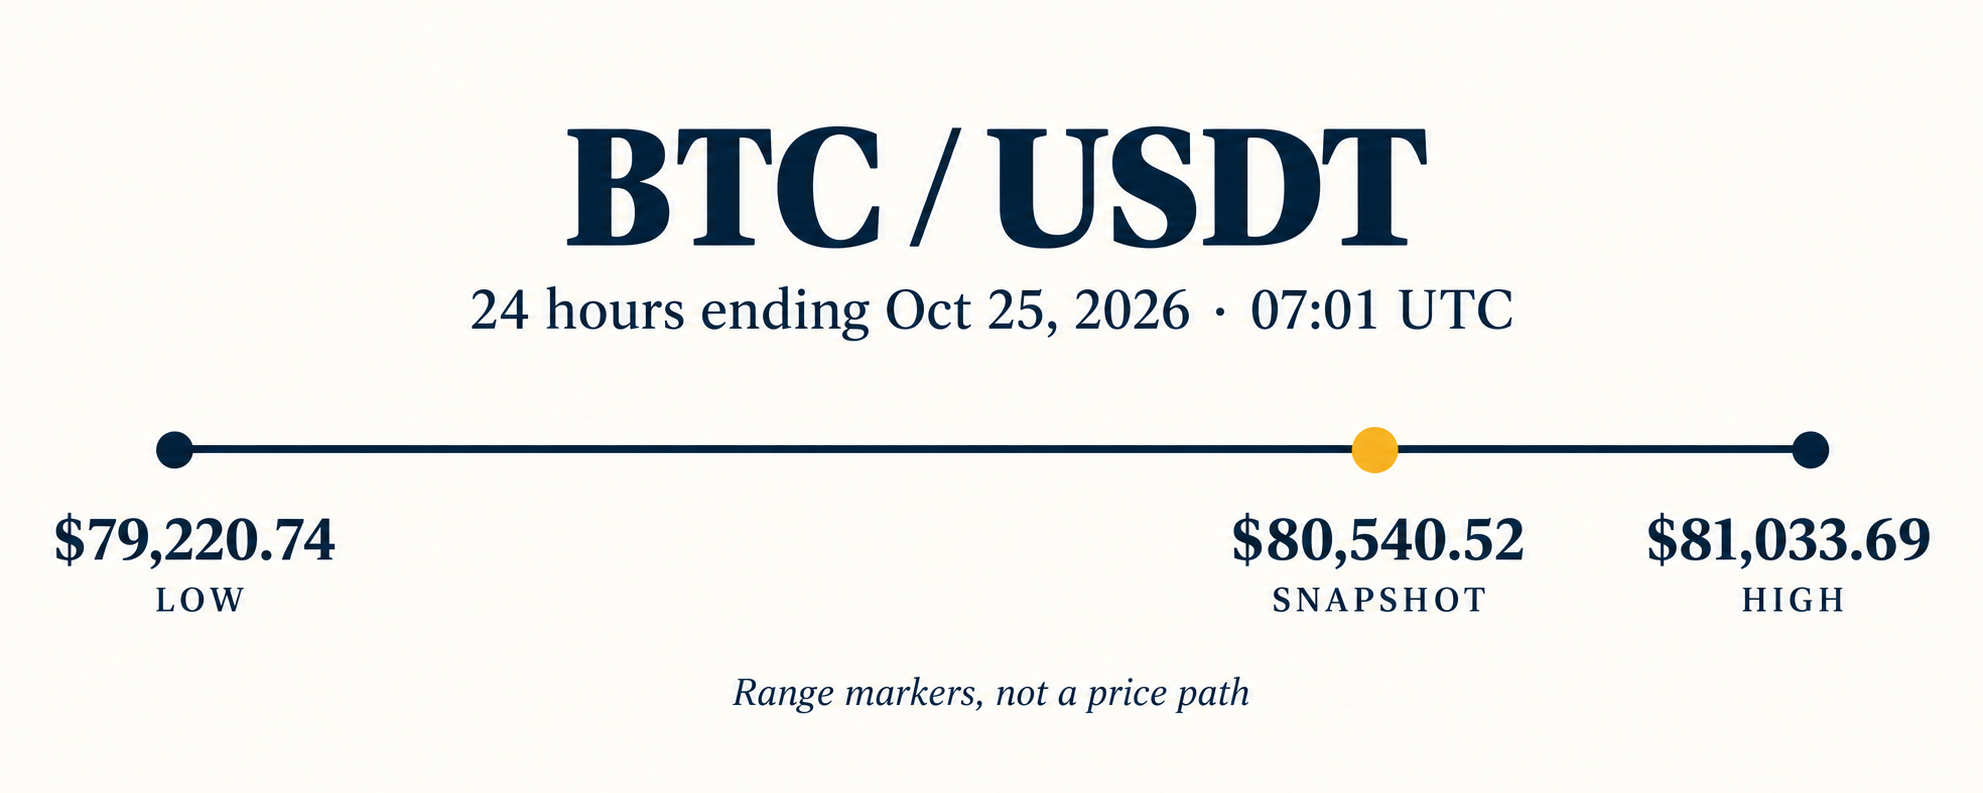
AI-generated range illustration based on the saved Binance ticker; the markers do not depict a historical price path.
Did Bitcoin ETFs lose money all week?
The displayed daily totals imply a $301.2 million net inflow for October 19–23, despite two consecutive outflow sessions. In Farside Investors’ Bitcoin ETF table, October 22 shows a $635.6 million outflow and October 23 a provisional $137.9 million outflow. Friday’s HODL field is a dash, so the latest total should not be treated as fully reported.
| U.S. trading session | Displayed net flow, USD millions |
|---|---|
| October 19 | +526.7 |
| October 20 | +23.2 |
| October 21 | +524.8 |
| October 22 | -635.6 |
| October 23 | -137.9, provisional |
| Sum of displayed daily totals | +301.2, provisional |
Thursday and Friday together removed $773.5 million. The first three sessions had brought in $1,074.7 million. Subtract one from the other and the week stays positive. That arithmetic does not make the late-week deterioration disappear, but it does change the description from a full-week exodus to a sharp reversal inside a positive week.
ETF subscriptions and redemptions are one channel of demand. They do not measure every Bitcoin buyer, and the daily table is not a real-time explanation for a Sunday price tick. A weekly sum also hides the order of events: an inflow early in the week and an outflow late in the week can leave a positive total while momentum worsens.
For the next completed U.S. session, watch whether selling persists and whether missing reports revise the comparison. A smaller outflow can be an improvement without being renewed demand. Markets are perfectly capable of making an encouraging number feel uncomfortable.
Why does $80,000 matter now?
$80,000 is a nearby psychological reference; $79,220.74 and $81,033.69 are the observed range boundaries. Those are different kinds of evidence. Round numbers can attract attention, while an actual traded low or high shows where the measured window reached.
| Reference | Basis | What a subsequent move would help assess |
|---|---|---|
| $79,220.74 | Saved rolling 24h low | Whether the current observed floor survives |
| $80,000 | Round-number reference | Whether the recovery retains its psychological foothold |
| $80,804.92 | Saved rolling opening price | Whether BTC reverses the measured net decline |
| $81,033.69 | Saved rolling 24h high | Whether price can extend beyond the observed range |
These are monitoring levels, not instructions to place orders. A move through a boundary may fade immediately, and a single print says less than sustained trading with sufficient liquidity. Nothing in this snapshot establishes the probability of either outcome.
The broader context comes from Glassnode’s October 21 on-chain report. It placed tracked treasury cost basis around $80.2K and the True Market Mean near $77.6K, with overhead supply around $85K–$87.5K. Those are older model-based reference points, not a fresh October 25 order-book reading. They help explain attention around $80K without proving that the same bids remain available today.
Whale activity needs the same discipline. A large transfer can reflect custody changes, exchange operations or a sale; its size alone does not establish intent. This research does not include a verified current whale-accumulation series, so there is no fresh accumulation total to attach to today’s rebound. The price recovery stands on its own evidence.
Ether and Solana are lagging, but this is a small sample
Ether underperformed Bitcoin by 1.154 percentage points, while Solana lagged by 0.436 percentage points. Both differences are calculated from the three Binance rolling returns above. They describe relative weakness in this window, not the entire altcoin market.
For a trader evaluating market breadth, that distinction is important. Bitcoin holding a prominent level while two major alternatives fall faster is a defensive pattern within the sample. It does not establish that every smaller token is selling off, nor does it establish a durable rotation into BTC.
A useful follow-up would compare the same pairs at another recorded cutoff and add a broader, consistently defined asset universe. Changing the exchange, time window or token sample halfway through the comparison can manufacture a trend that is mostly methodology.
The rebound also deserves proportion. All three last prices were above their rolling lows, yet all three remained below their respective rolling opening prices. Recovery from a low and a negative daily return can coexist. Calling that a clean reversal would ask a short dataset to do a long job.
The global market snapshot adds caution
CoinGecko’s saved API response put total crypto capitalization at $2.712 trillion, down 3.077% over 24 hours. It recorded $55.70 billion in aggregate volume and Bitcoin dominance of 59.52%. These figures cover CoinGecko’s global universe and update cycle, so they should not be directly reconciled with three Binance pairs.
The CoinGecko global charts page is the reader-facing reference. Its rendered figures differed from the API during research. The article consistently uses the captured API response rather than combining whichever values look newest across the two surfaces.
Market capitalization is a valuation calculation, not a cash-flow ledger. A decline in aggregate capitalization does not mean the same dollar amount was withdrawn from exchanges. Dominance likewise measures Bitcoin’s share of that valuation universe; it does not tell us who bought or whether those purchases came from institutions.
Keep execution costs visible
If you choose to trade the setup, compare the spread, available order-book depth and fees before increasing turnover. A limit order controls its price but may remain unfilled; an immediately executable order can incur taker fees even if entered as a limit order.
Create a Binance account with referral code RATE20 →
The link includes referral code RATE20. Check the referral benefit displayed at registration, regional eligibility and the applicable fee schedule before signing up. This is a referral link, and SmallDrift may receive a commission. Our guide explains the offer: Get 20% off with code RATE20.
Do not assume referral, BNB-payment and product-specific discounts always combine. A promotion on one market does not establish your rate on another, and maker status depends on how an order executes. Fees are predictable only after the relevant terms are checked.
Binance news does not establish a market catalyst
The official Binance newsroom listed October 22 trading promotions and October 23 Alpha removals during this research. That is relevant operational context for users of affected products, but the available evidence does not connect those notices causally to Bitcoin’s weekend move.
Before participating in a promotion, check its eligible pairs and local restrictions. Additional turnover has a cost even when a reward pool sounds attractive. Buying an unrelated token to qualify for a competition also adds a separate price exposure to the Bitcoin decision you started with.
What would strengthen or weaken this recovery?
A stronger recovery would first retain $80,000, then move beyond the saved opening price and rolling high. Better relative performance from Ether and Solana would broaden the evidence. A subsequent ETF inflow would add another observation, provided the date and reporting status are clearly identified.
A weaker outcome would lose the round number and revisit the recorded low. That would invalidate the narrow claim that the current snapshot is holding above $80K; it would not automatically establish a destination at an older on-chain model level. Price levels are checkpoints, not conveyor belts.
For either scenario, keep three questions separate: what has already traded, what outside investors reported for a completed session, and what you expect next. The first two are observable with qualifications. The third is a forecast, even when it comes dressed as a chart.
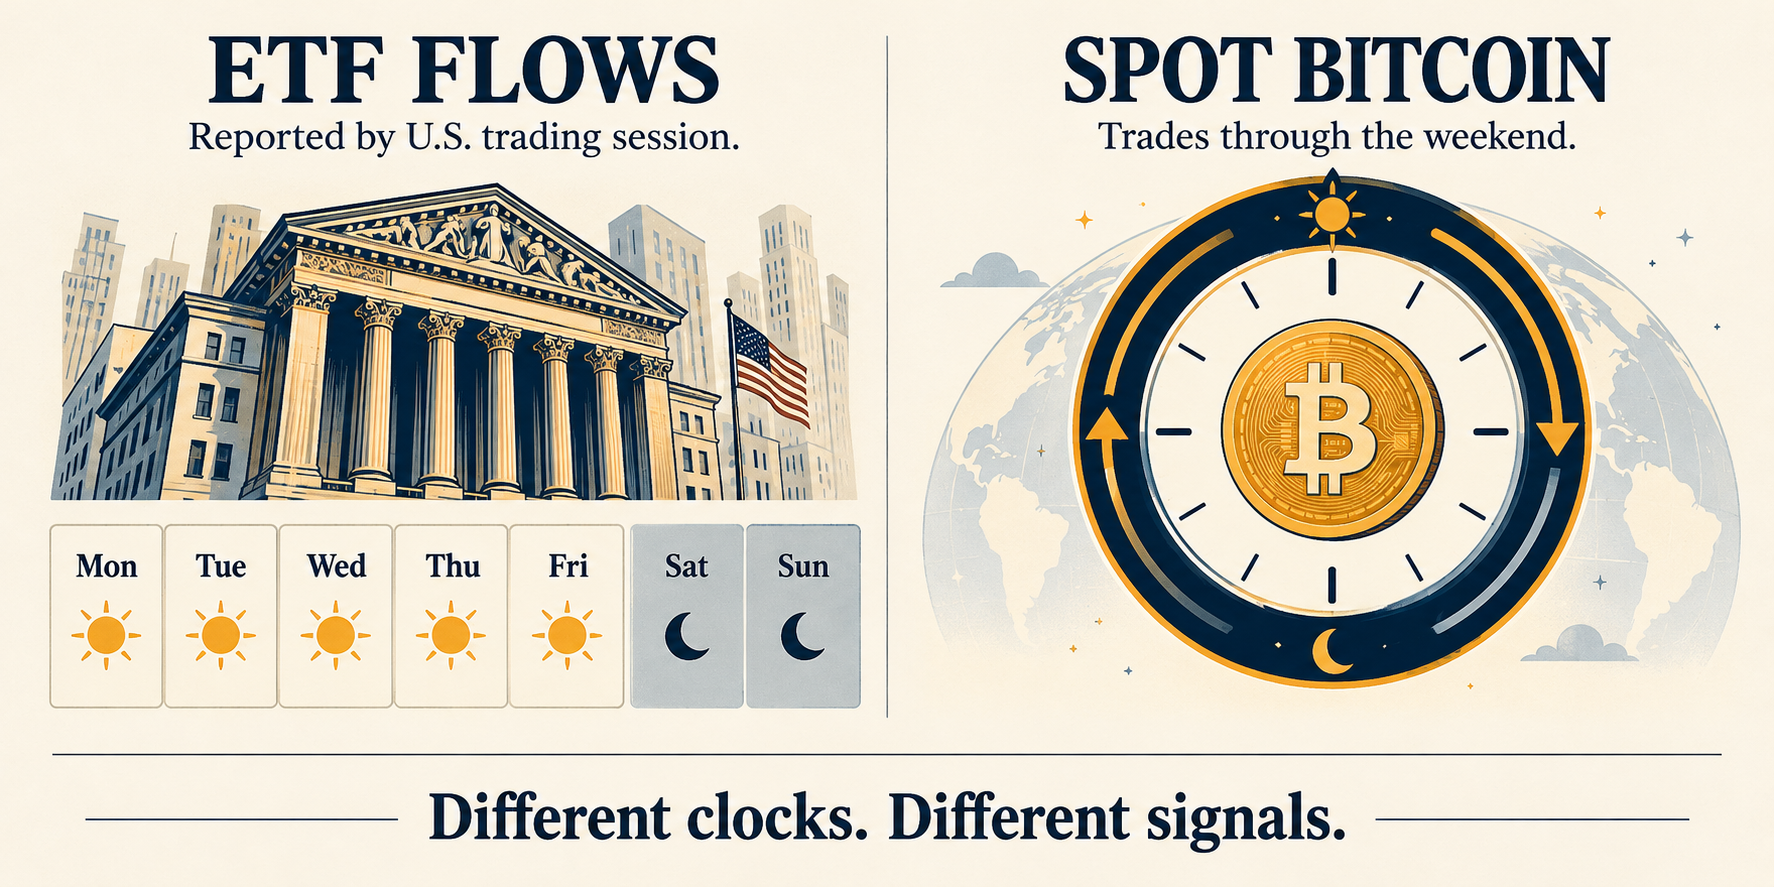
AI-generated explanatory illustration. ETF reporting sessions and continuous crypto trading operate on different clocks.
Frequently asked questions
Is Bitcoin above $80,000 today?
Yes, at the saved October 25 snapshot it was $80,540.52 on Binance BTC/USDT. The rolling window included a lower trade at $79,220.74. Live prices may already differ, so use the research cutoff when comparing this article with a market page.
Were Bitcoin ETF flows negative for the week?
The displayed October 19–23 daily totals summed to a provisional $301.2 million inflow. The last two sessions were negative, and Friday still had an unreported HODL entry. Both the weekly balance and its late-week deterioration matter.
What Bitcoin levels should readers monitor next?
The nearest references are $80,000, the $79,220.74 rolling low and the $81,033.69 rolling high. They describe the captured range and its nearby round number. They are not guaranteed support, resistance or recommended entry prices.
Review Binance registration with code RATE20 →
Check the displayed referral terms before completing registration. A fee benefit does not reduce the risk of a losing trade.
This article is for informational purposes only and does not constitute financial advice. Always do your own research before making investment decisions.
Get 20% Off Binance Trading Fees with RATE20
New to Binance? Open the official signup page with RATE20 already applied for a 20% trading-fee discount. You do not need to copy or type the code. Review the referral details before completing registration.
- Referral code: RATE20, pre-applied by this link
- Fee discount: 20%, shown on the Binance signup screen
- Additional rewards: Check Binance for current promotions and regional availability
Be wary of unofficial referral offers promising benefits they cannot show. The Binance signup screen lets you check the code and fee discount directly.
Compare Binance fees and available discounts →
SmallDrift may earn a commission when you sign up through this link. Trading involves risk, including loss of capital.
Related Articles



Explore Related Guides
Daily Crypto Market News
Follow Bitcoin price moves, major altcoins, and the events shaping the market.
Bitcoin ETF Flows Guide
Understand ETF inflows and outflows, and how to read them alongside price action.
Binance Fee Calculator
Learn how to estimate trading costs with referral and BNB discounts.
Verified Binance Referral Guide
See how RATE20 is applied and what to check on the Binance signup screen.