Bitcoin's $80,000 Weekend Test — October 24, 2026
Bitcoin sits near $80,800 as Friday ETF withdrawals extend selling. A dated market snapshot separates the $80,000 test from a confirmed breakdown.

Bitcoin is only about 1% above 80,000 USDT, and another session of ETF withdrawals has made the weekend harder to dismiss. Yet the week’s reported fund flows remain positive, complicating the easy story that institutions have simply abandoned the market. For anyone watching support, the useful question is whether buyers can absorb supply at this level without mistaking a brief bounce for a recovery.
Research cutoff: October 24, 2026, 07:02:58 UTC. Exchange figures below are saved Binance spot API snapshots, with rolling 24-hour windows ending around 07:00:46 UTC. Prices are quoted in USDT, not bank-settled US dollars. Linked market pages show current data and may differ from these historical observations; ETF totals can also be revised.
Where is Bitcoin trading on October 24?
BTC/USDT was 80,800.12 in the captured snapshot, down 1.333% over its rolling 24-hour window. The pair’s high was 82,060.88 and low was 80,513.00, putting the last price toward the lower end of that observed range.
The official Binance market overview provides the reader-facing market reference. The numbers here come from preserved responses rather than whatever quote that page displays when you open it.
| Binance spot pair | Snapshot price, USDT | Rolling 24h change | Rolling low | Rolling high | Quote volume, USDT |
|---|---|---|---|---|---|
| BTC/USDT | 80,800.12 | -1.333% | 80,513.00 | 82,060.88 | 928.33 million |
| ETH/USDT | 2,378.84 | -1.283% | 2,351.55 | 2,417.77 | 467.43 million |
| SOL/USDT | 102.20 | -2.397% | 101.73 | 105.24 | 170.16 million |
These windows run from approximately October 23 at 07:00:46 UTC to October 24 at 07:00:46 UTC; SOL’s endpoints are about half a second earlier. Quote volume measures trading on these individual Binance pairs, not total global activity.
There are two practical readings. First, the snapshot does not show Bitcoin trading below 80,000. Calling this a confirmed breakdown would get ahead of the evidence. Second, being above a round number is a thin achievement when price remains close to the rolling low.
A market can hold support while still offering an unattractive entry. The distance between your entry and an invalidation point matters as much as the headline level. A chart does not reimburse impatient execution.
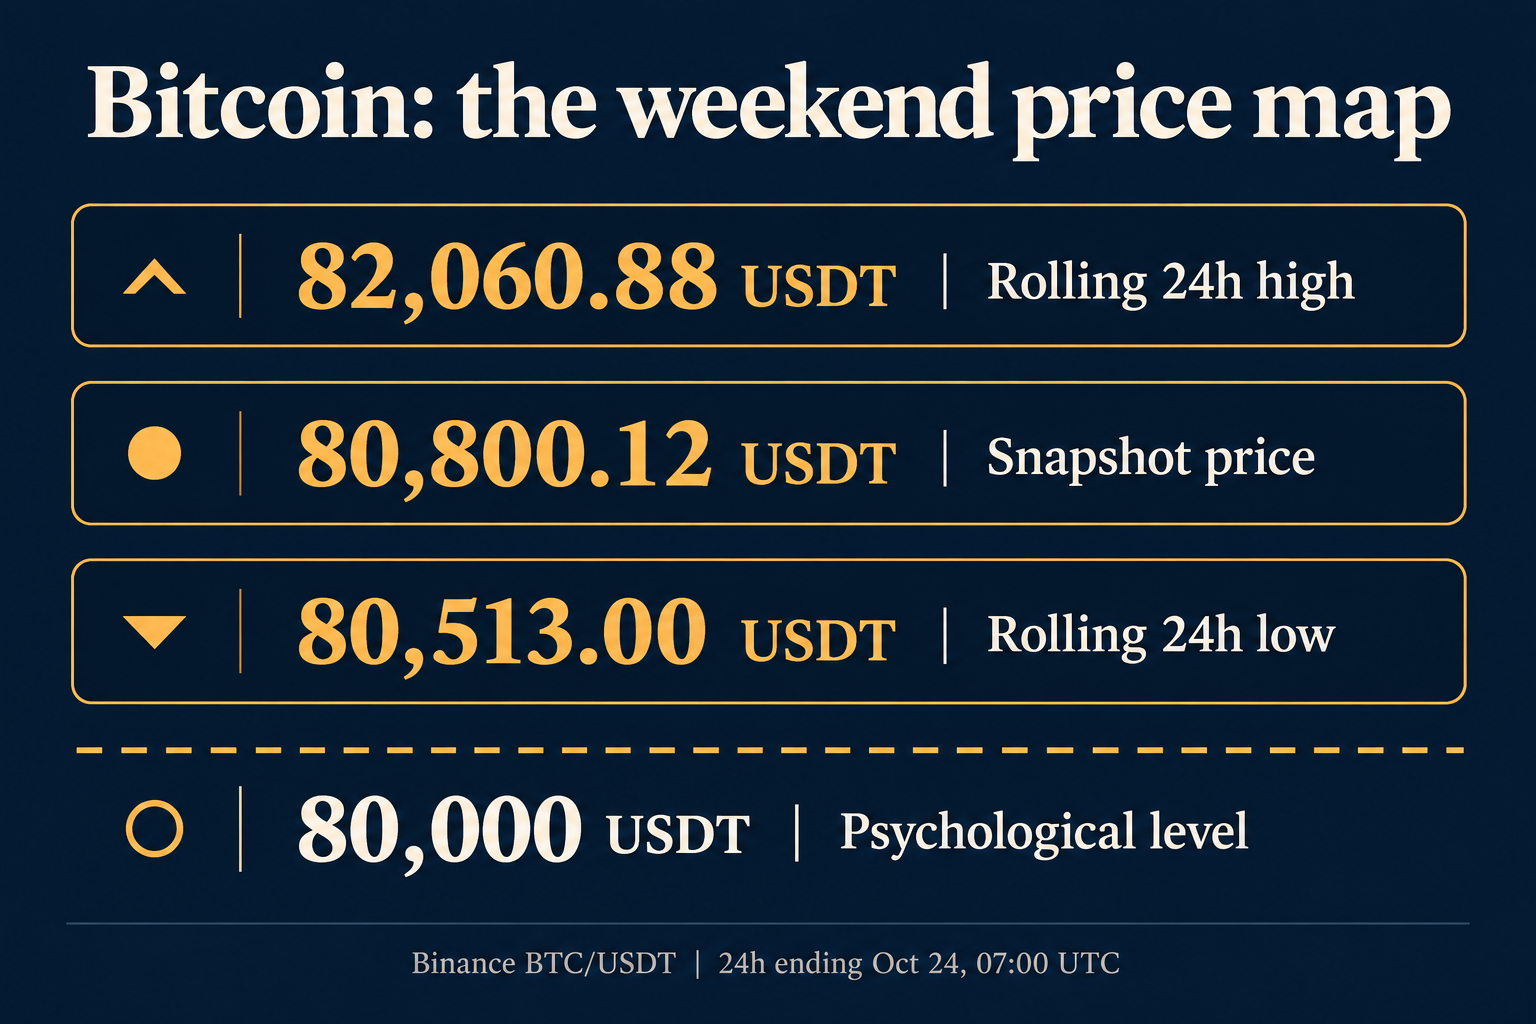
AI-generated infographic using the saved BTC/USDT snapshot. The 80,000 marker is a psychological reference, not an observed low or forecast.
Friday’s ETF outflow changes the weekend question
The Farside Bitcoin ETF table reports these daily totals, in millions of US dollars:
| US session | Reported net flow |
|---|---|
| October 19 | +$526.7 million |
| October 20 | +$23.2 million |
| October 21 | +$524.8 million |
| October 22 | -$635.6 million |
| October 23 | -$137.9 million |
The last two sessions sum to $773.5 million in withdrawals. The five displayed totals still sum to $301.2 million of weekly net inflows. Friday’s table includes a dash for HODL, so treat that day’s aggregate and the weekly calculation as provisional.
That distinction matters: recent selling weakened a positive week rather than making every session negative. ETF flows measure net fund activity; they do not independently prove the cause of a Bitcoin price move.
The weekend creates a timing problem for interpretation. Spot Bitcoin keeps trading while US exchange-listed ETF shares wait for their next regular session. A Saturday bounce therefore cannot be described as fresh Monday ETF demand. Equally, a Saturday decline does not tell us how the next session’s creations and redemptions will finish.
For traders, the useful exercise is to keep two separate questions on the screen. Can spot demand hold the nearby price area now? And does the next reported US session confirm or reverse the recent withdrawal pattern? Combining them into one story feels tidy, but it hides the information gap.
What does the broader crypto market show?
The saved global response behind CoinGecko’s market charts puts total capitalization at approximately $2.722 trillion, down 3.932% over 24 hours, with about $64.19 billion of reported volume. Bitcoin dominance was 59.467%. The API’s update field corresponds to 06:57:37 UTC on October 24.
Its live HTML page displayed different figures during research. This article consistently uses the preserved API response rather than blending the two versions into a supposedly synchronized market total.
The exchange-pair comparison also shows SOL falling more than BTC or ETH in the captured windows. That is evidence of uneven weakness across this small sample, not proof of a universal altcoin selloff.
A capitalization decline is not the same thing as an equal dollar amount leaving the industry. Market value marks circulating supply at prevailing prices; it is not a ledger of cash withdrawals. Similarly, a dominance reading alone does not establish capital rotation. Bitcoin’s share can change because other assets fall faster, even without new Bitcoin buying.
For someone holding several crypto assets, the immediate lesson is about correlated exposure. Three different tickers can still leave a portfolio dependent on the same broad rebound. Before treating an altcoin as diversification, ask how it behaves when the major market weakens and whether its order book can support your intended trade size.
The $80,000 level needs evidence, not mythology
A useful support level defines a test; it does not guarantee the result. Here is a compact map separating current exchange observations from older research estimates.
| Reference | Level | What it actually represents |
|---|---|---|
| Rolling low | 80,513 USDT | Lowest Binance BTC/USDT trade in the captured window |
| Psychological threshold | 80,000 USDT | Round-number reference, not a guaranteed floor |
| Rolling high | 82,060.88 USDT | Top of the same exchange window |
| Older holder-cost zone | About $80,200–$81,500 | Dated corporate treasury and ETF estimates |
| Older overhead zone | About $85,000–$87,500 | Dated on-chain and market-structure research |
Glassnode’s October 21 report places corporate treasury cost near $80,200 and ETF cost near $81,500. Its relevant holder-cost observations are dated October 19; its order-book and liquidation observations extend to October 21. Those estimates explain why this neighborhood attracts attention, but they are not today’s executable bids.
Cost basis is a model of an investor group’s average entry, not a coordinated promise to defend that price. Some holders may reduce exposure below it, others may add, and others may do nothing. A cluster of estimated entries can help frame uncertainty without resolving it.
This article does not attach a fresh whale-accumulation number to the setup: no independently verified current wallet-flow series was captured. An exchange withdrawal alone would not establish a purchase anyway. Transfers between custodians, internal wallet changes and address-label limitations can all complicate the interpretation.
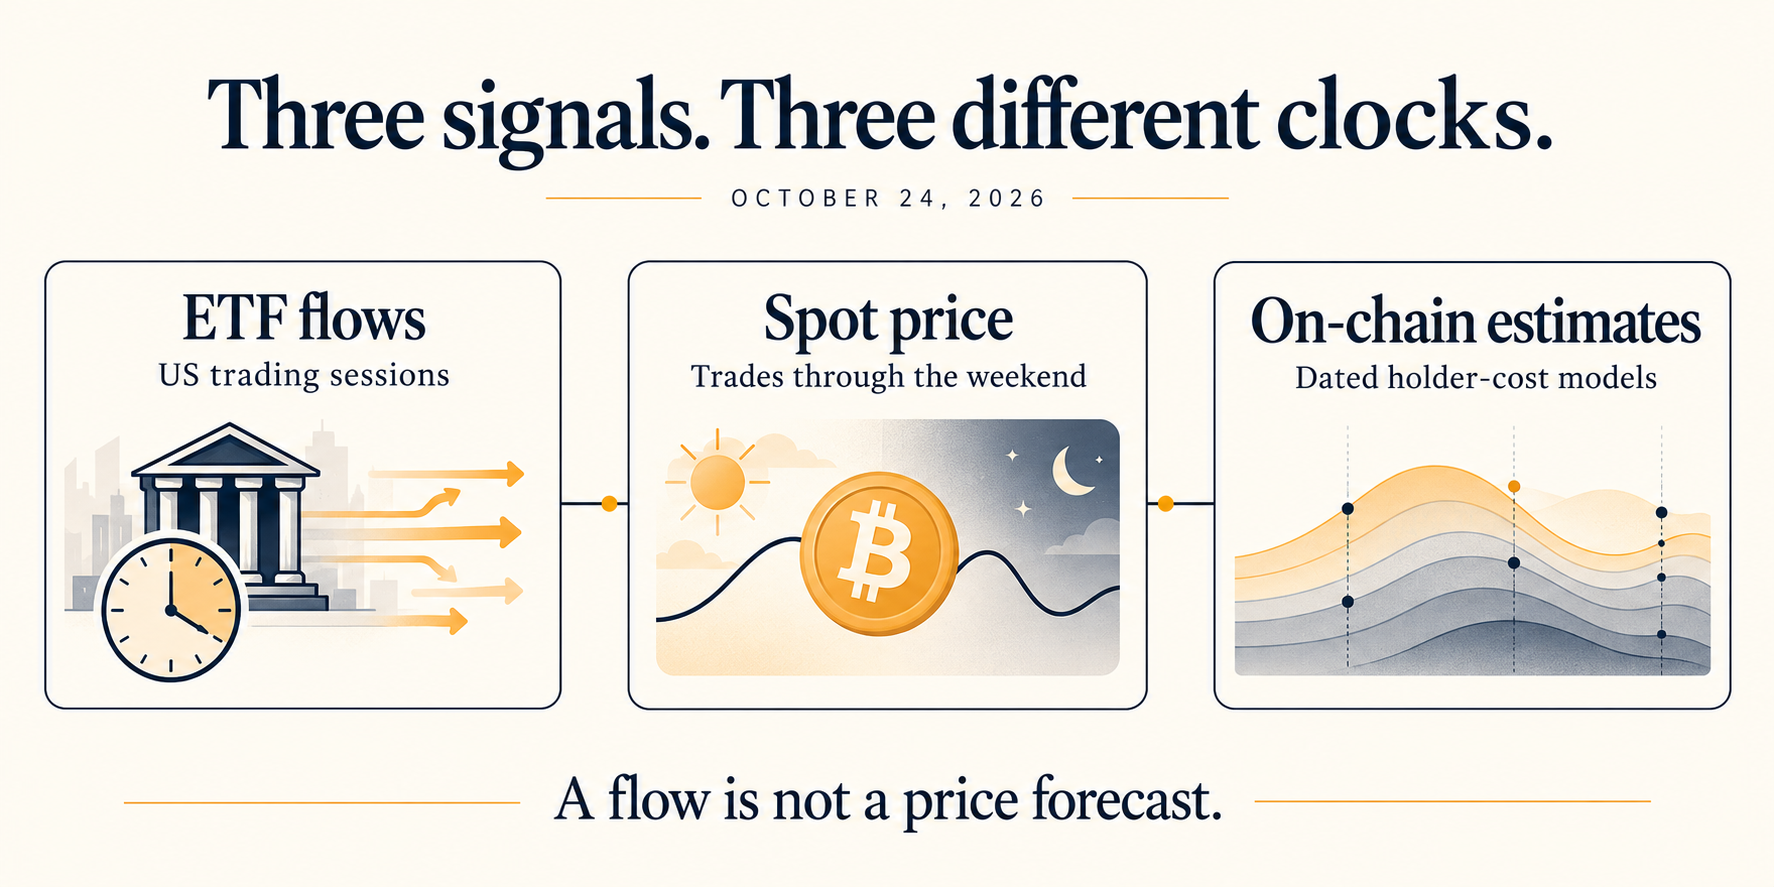
AI-generated conceptual explainer. Decorative curves are not measured price or on-chain series.
Three scenarios worth watching
Buyers defend the recent low
A retest followed by sustained trading above the observed low would be more informative than a single upward print. The key word is sustained. Repeatedly losing the same level and bouncing briefly can indicate a contested market rather than a secure floor.
Even a successful defense would leave the rolling high overhead. Buyers would still need to show that demand can persist away from the most obvious round-number area. This is a conditional framework, not a probability estimate.
Price regains the rolling high
Trading above 82,060.88 would move price beyond the top of the captured window. That would improve the immediate range picture, but it would not automatically clear every older supply zone or settle the ETF question.
For confirmation, compare subsequent price behavior with fresh volume and the next available fund-flow report. Avoid treating a higher price, a larger turnover number and a positive flow total as interchangeable signals: each measures a different part of demand.
Price loses 80,000
A move through 80,000 would invalidate a simple claim that this round number is holding throughout the weekend. What happens afterward matters: a quick reclaim and continued trading below it are different outcomes.
Neither warrants pretending that the next support is mechanically certain. Decide in advance which observation changes your position size or invalidates your thesis. Otherwise, a planned trade can quietly become an unplanned long-term holding.
Check execution before opening a position
A market near support can tempt traders to increase size because the stop looks close. But slippage, a fast move through the trigger and correlated positions can make realized loss exceed the neat figure on a planning sheet. Limit orders offer price control while introducing the risk of no fill; market orders prioritize execution while exposing you to available liquidity.
If Binance is available to you and you choose to use it, compare the displayed fees and order conditions before placing a trade.
Register on Binance with referral code RATE20 →
The link pre-applies RATE20. Check the referral benefit shown during registration and your account’s eligibility; this article does not independently verify a universal discount rate. This is an affiliate link, and SmallDrift may receive compensation. Our guide explains the signup offer: Get 20% off with code RATE20.
Binance headlines need their own verification
The official Binance announcement center was checked during research, but the accessible view did not establish a specific new October 24 listing or product release. There is no verified announcement catalyst in this article’s market explanation.
That is a useful boundary. A token appearing among a platform’s newest or strongest performers is not enough to date an announcement, establish eligibility or explain a broader Bitcoin move. Read the original notice, its effective time and the affected pairs before trading a listing narrative.
Keep fees proportional to the trade
Fees matter most when a strategy repeats small trades. Spread, slippage and unsuccessful attempts can also consume a narrow expected edge. A promotional percentage cannot tell you the total cost without knowing the applicable base fee and transaction type.
This article therefore does not promise that referral benefits, BNB payments and maker pricing stack for every account or product. Check the final fee shown for your actual order and compare it with the move you are trying to capture. Lower costs improve execution economics; they do not make a weak setup profitable.
Review Binance registration with RATE20 →
Use the displayed registration terms to confirm any referral benefit before proceeding. There is no need to place a trade simply because a signup link is available.
Frequently asked questions
Is Bitcoin below $80,000 on October 24, 2026?
Not in this article’s saved Binance snapshot. BTC/USDT was 80,800.12, with a rolling low of 80,513. Those are USDT quotes at the stated observation time, not a claim about the entire calendar day or the price when you read this.
Did Bitcoin ETFs have a negative week?
The five displayed Farside daily totals sum to a positive $301.2 million. Thursday and Friday together were negative $773.5 million, so the recent direction was weaker than the weekly balance. Friday contains a missing fund entry and remains provisional.
Does holding $80,000 confirm a Bitcoin recovery?
No: it would establish only that the level held over the interval observed. A stronger recovery case would require additional evidence from subsequent price action and demand. The next ETF session and fresh market observations can change the picture; older estimates cannot substitute for them.
This article is for informational purposes only and does not constitute financial advice. Always do your own research before making investment decisions.
Get 20% Off Binance Trading Fees with RATE20
New to Binance? Open the official signup page with RATE20 already applied for a 20% trading-fee discount. You do not need to copy or type the code. Review the referral details before completing registration.
- Referral code: RATE20, pre-applied by this link
- Fee discount: 20%, shown on the Binance signup screen
- Additional rewards: Check Binance for current promotions and regional availability
Be wary of unofficial referral offers promising benefits they cannot show. The Binance signup screen lets you check the code and fee discount directly.
Compare Binance fees and available discounts →
SmallDrift may earn a commission when you sign up through this link. Trading involves risk, including loss of capital.
Related Articles



Explore Related Guides
Daily Crypto Market News
Follow Bitcoin price moves, major altcoins, and the events shaping the market.
Bitcoin ETF Flows Guide
Understand ETF inflows and outflows, and how to read them alongside price action.
Binance Fee Calculator
Learn how to estimate trading costs with referral and BNB discounts.
Verified Binance Referral Guide
See how RATE20 is applied and what to check on the Binance signup screen.