Bitcoin Reclaims $80K: Is Demand Back? November 5, 2026
Bitcoin rises 3.41% above 80,000 USDT as ETF flows turn positive. The range high, fund-level selling and exchange recovery still test the rebound.
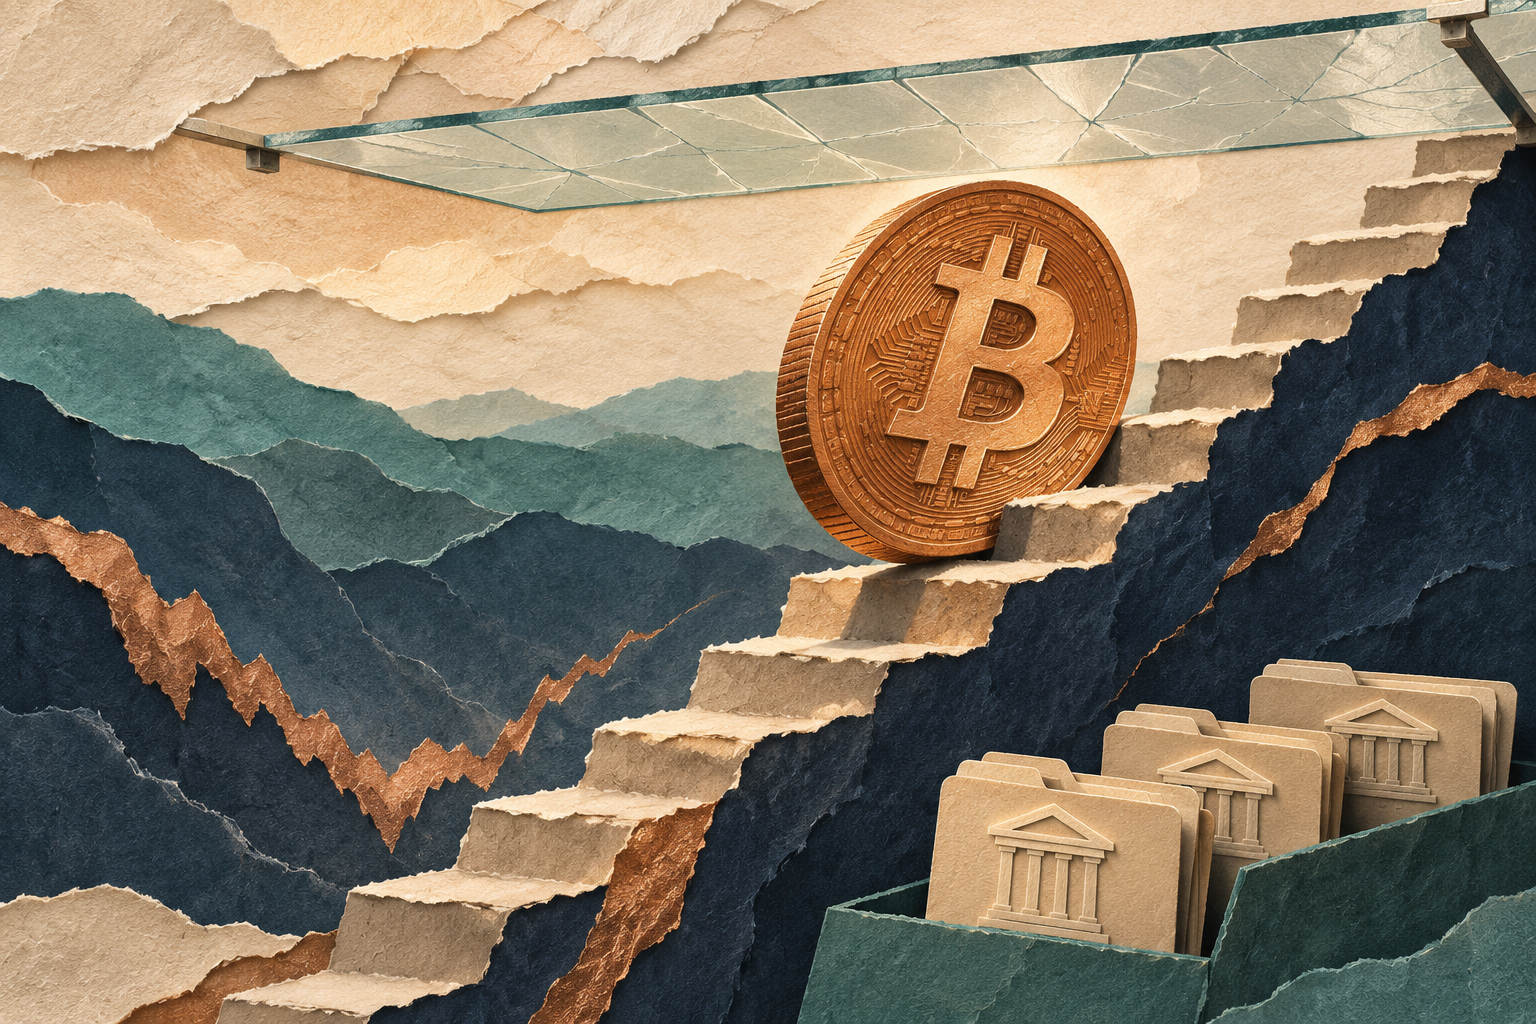
Bitcoin has reclaimed 80,000 USDT, but the buyers have more work to do. Its 3.41% rolling gain puts price near the top of the latest trading range, while ETF demand has only just returned to positive territory. If you are treating this rebound as confirmation that the market has repaired itself, today’s numbers argue for a more demanding test.
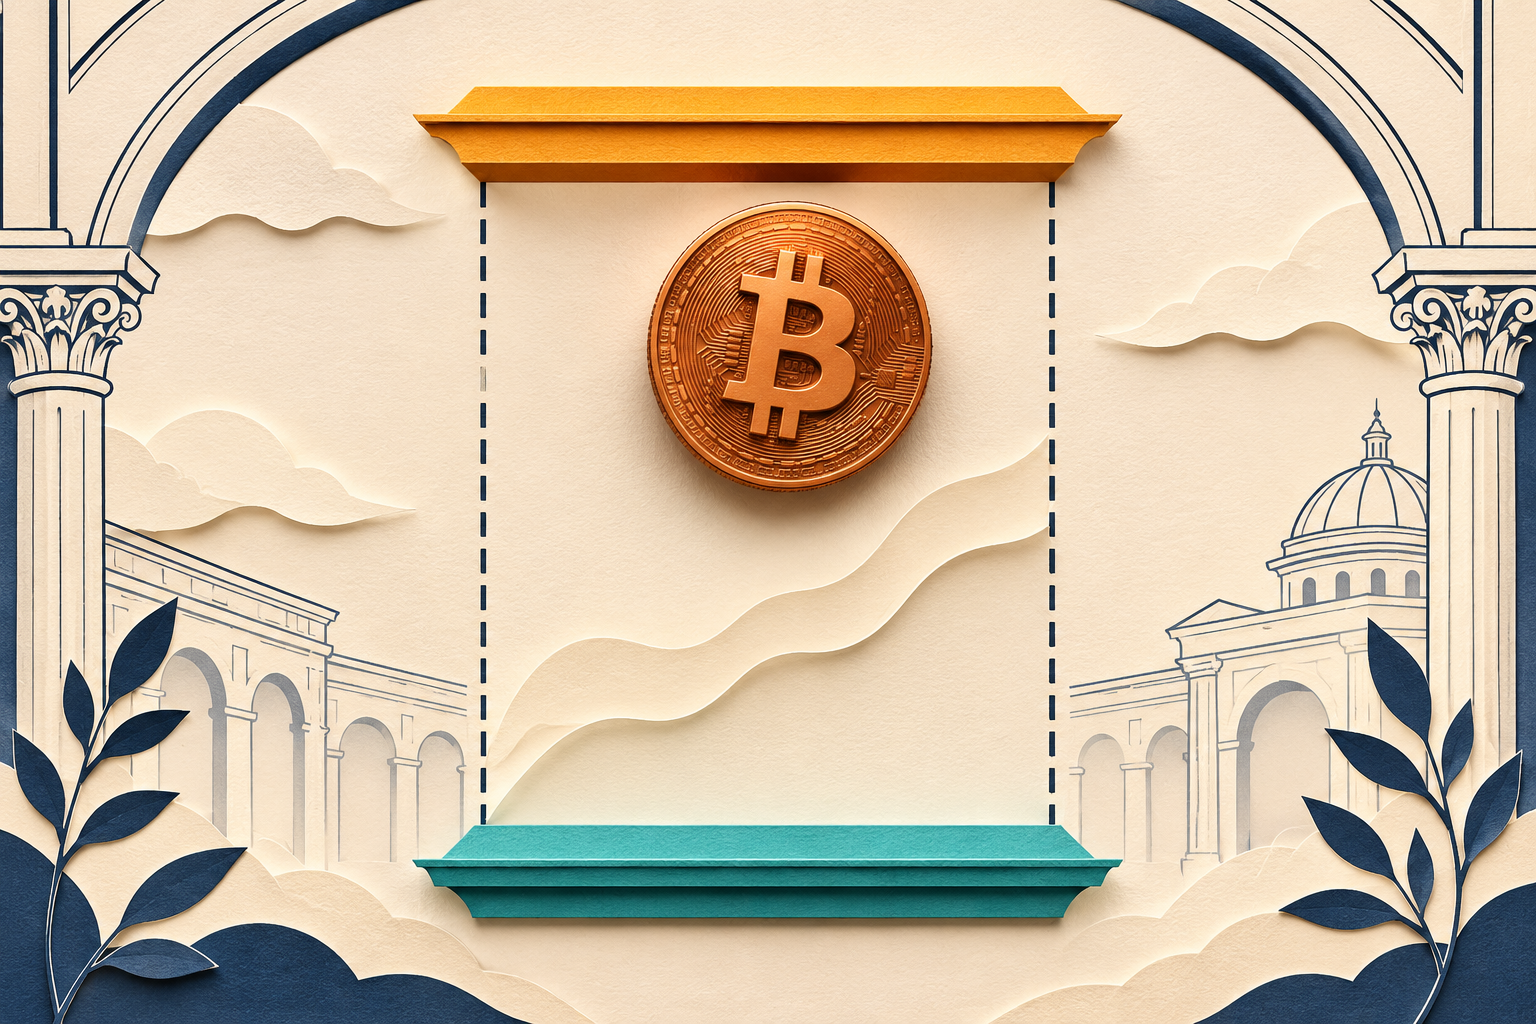
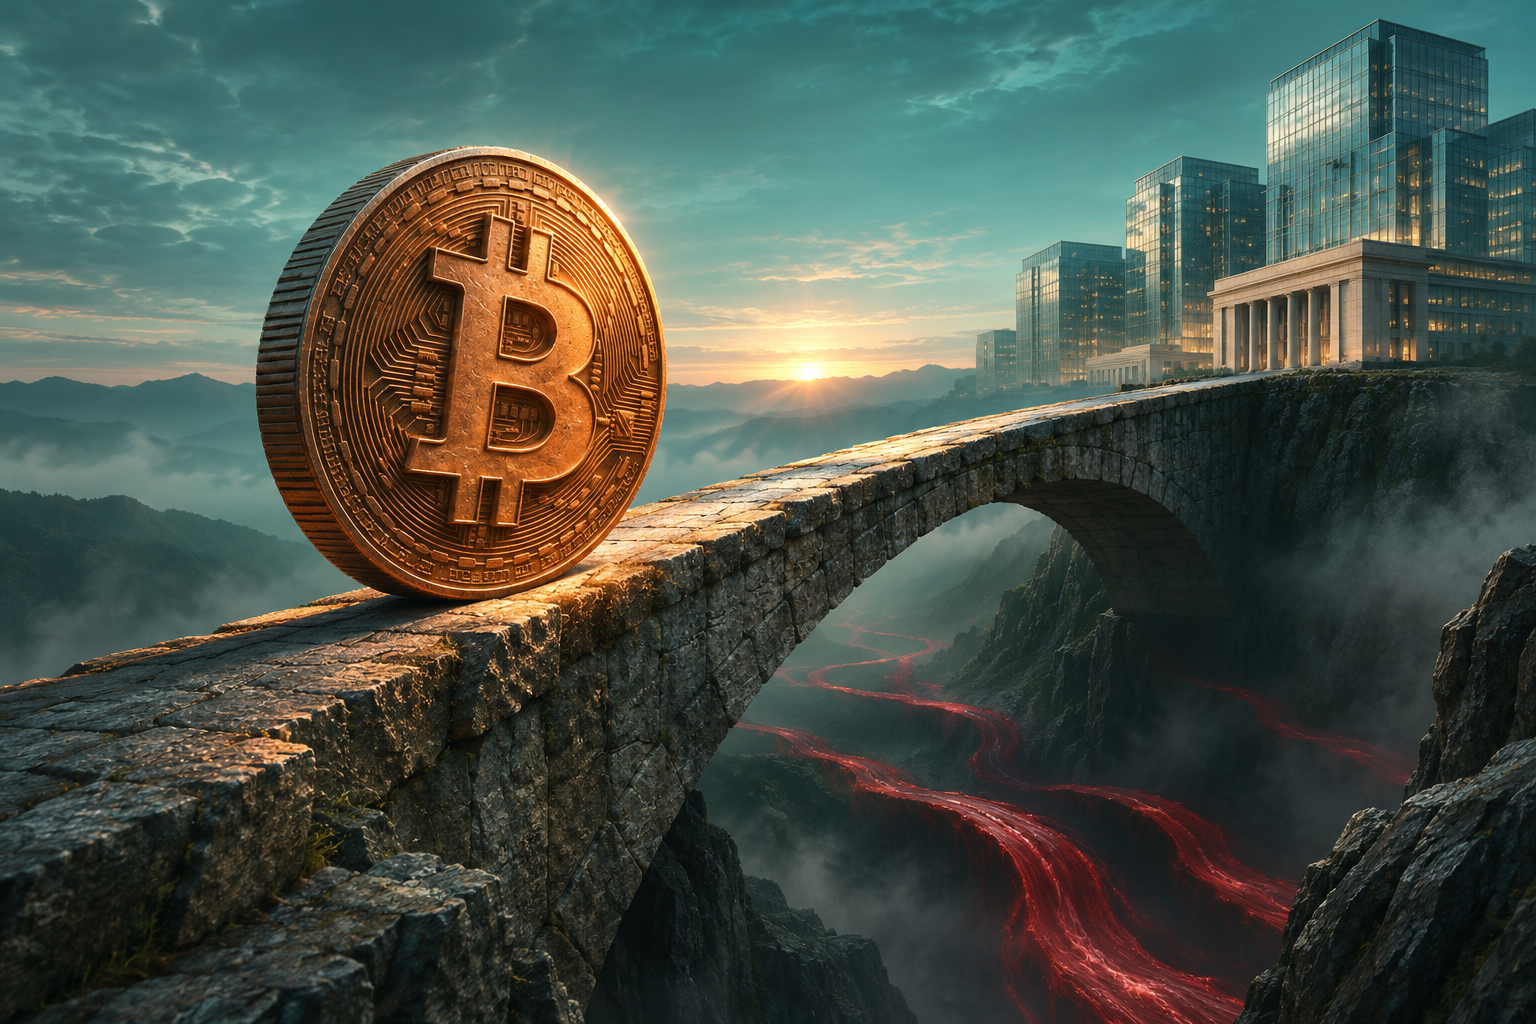
Research cutoff: November 5, 2026, 07:05:03 UTC. Binance spot data was retrieved at 07:01:37 UTC; each pair’s rolling 24-hour window ends around 07:01:37 UTC on November 5 and begins around the same time on November 4. ETF figures refer to completed US trading sessions. CoinGecko’s global snapshot was retrieved at 07:01:37 UTC and last updated at 06:56:25 UTC. Linked market pages show current data and may differ from this historical snapshot. All three images are original AI-generated conceptual illustrations, not price charts or documentary photographs.
What is Bitcoin’s price today?
Bitcoin traded at 80,649.35 USDT on Binance, up 3.407% over its rolling 24-hour window. That leaves it 546.66 USDT below the window’s 81,196.01 high and 2,758.55 USDT above its 77,890.80 low.
The important distinction is between recovering a round number and clearing the actual trading range. Eighty thousand attracts attention because it is easy to remember. The observed high matters because sellers have already met buyers there.
Here is the exchange-specific snapshot. Prices are in USDT per coin; turnover is the quote-asset value traded in the named Binance spot pair, not worldwide trading volume.
| Binance spot pair | Last price, USDT | Rolling 24h change | Rolling low–high, USDT | Rolling quote turnover |
|---|---|---|---|---|
| BTC/USDT | 80,649.35 | +3.407% | 77,890.80–81,196.01 | 1.516 billion USDT |
| ETH/USDT | 2,429.69 | +5.746% | 2,295.16–2,450.00 | 730.14 million USDT |
| SOL/USDT | 96.21 | +3.496% | 92.47–98.14 | 252.74 million USDT |
You can follow the assets on Binance’s official market overview. Its displayed aggregate asset figures can use different inputs from these individual spot-pair observations. A USDT quote is also not a guarantee that the same dollar price is available on every venue.
The range position makes the setup less comfortable than the headline gain suggests. Bitcoin sits about 83.5% of the way from the rolling low to the high. That calculation describes location within an observed window; it does not measure the probability of an upward breakout.
Buying near the upper end of a range means paying for some of the recovery before the market has demonstrated that it can hold above the ceiling. The rally may continue. The entry still needs its own logic.
Which Bitcoin support and resistance levels matter?
The nearest observed resistance is 81,196 USDT; the first references below price are 80,000 and the rolling weighted average near 79,885. These are working observation levels derived from the retrieved ticker, not a claim about a confirmed multiweek technical pattern.
| Reference | Level, USDT | Why watch it? | Limitation |
|---|---|---|---|
| Rolling high | 81,196.01 | First visible ceiling in this snapshot | One print above it does not prove acceptance |
| Round-number pivot | 80,000 | Simple reference for whether the reclaim holds | Psychological level, not measured order-book support |
| Rolling weighted average | 79,885.40 | Average traded price weighted by BTC volume | Changes as the 24-hour window rolls |
| Rolling opening price | 77,992.01 | Baseline for the reported percentage gain | Not a daily UTC candle open |
| Rolling low | 77,890.80 | Downside boundary observed in the window | Not a guaranteed floor |
The constructive scenario is straightforward: price clears the high, then continues trading above it instead of immediately slipping back inside the range. A later pullback that holds the reclaimed area would offer stronger evidence than a brief upward spike.
The weaker scenario begins with rejection near the high and a loss of 80,000. That would bring the weighted average into focus. If price also falls below that reference, the argument shifts from an advancing recovery toward a possible return to the range’s lower portion.
Do not read the weighted average as a magic moving average. It is calculated across the ticker’s rolling window and can move even when the latest price barely changes. For a longer horizon, you would need a matching history of candles, volume and market structure. This snapshot does not supply that history.
ETF flows improved, but the fund mix still matters
Farside Investors’ primary table shows 74.6 million dollars of net inflows on November 4, following 115.6 million dollars of outflows on November 3.
| US trading session | Net Bitcoin ETF flow |
|---|---|
| October 30 | −$643.2 million |
| November 2 | −$398.6 million |
| November 3 | −$115.6 million |
| November 4 | +$74.6 million |
Those four sessions total approximately $1.083 billion of net outflows, calculated from the displayed daily totals. November 4’s fund mix was uneven: FBTC added $236.7 million while IBIT lost $201.2 million.
My reading: one positive session interrupts the selling sequence; it does not establish persistent demand. Revisions remain possible. These US-session figures also cover a different interval from the rolling spot window, so they cannot prove what caused the rebound.

Ether leads, but three green coins do not establish an altcoin cycle
Ether’s 5.746% gain exceeded Bitcoin’s by 2.339 percentage points. Solana’s 3.496% advance was only 0.089 percentage points ahead of Bitcoin. That is a useful contrast: the larger relative move belongs to Ether, while Solana’s performance is roughly in line with BTC.
Relative returns tell you where price moved faster. They do not tell you why. These ticker responses contain no attribution separating new investment, short covering, portfolio rotation or exchange-specific order flow. Assigning the entire move to one of those explanations would go beyond the evidence.
The same restraint applies to breadth. A sample of three large assets can identify leadership within that sample, but it cannot establish that smaller tokens are participating. A convincing broad recovery would need a wider cross-section and more than one rolling observation.
The preserved CoinGecko global response puts total crypto capitalization at $2.715 trillion, up 0.70% over its reported 24-hour comparison, with $88.05 billion in volume and 59.56% Bitcoin dominance. These aggregate measures describe a different universe from Binance’s three spot pairs.
There is a source wrinkle worth making explicit. The rendered CoinGecko market charts showed approximately $2.79 trillion and a 3.2% daily change during research, differing from the retrieved global response. This article uses the preserved response consistently rather than combining the more convenient figures from each display. The mismatch limits how tightly we can align the aggregate backdrop with the spot rally.
What can we actually say about large holders?
The verified holder context is quarterly, not a same-day whale-buying signal. In its November 2 report, 21Shares’ Q3 demand analysis says long-term-holder balances fell by 248,000 BTC during Q3, while US spot ETFs added 79,800 BTC.
Those observations end September 30. Long-term holders are defined by coin age, not simply wallet size, so the category should not be relabelled “whales.” Nor does a quarterly balance reduction identify who is trading this morning.
The analytical lesson is narrower: assessing demand requires looking beyond newly mined supply. Existing holders can change their willingness to sell. No verified same-day whale accumulation series was obtained for this article, so today’s recovery should not be advertised as evidence that large wallets have returned.
Binance recovery: operational progress needs its own verification
In its November 4 recovery update, Binance said approximately 98% of the impacted amount had been replenished. It also reported a new reserve snapshot covering 44 tokens, with full zero-knowledge proof generation expected to take 50–60 hours.
Those are company statements about recovery, not an independent audit conclusion. The announcement describes withdrawals reopening in phases. Restoring trading access, replenishing assets and verifying a reserve proof are separate milestones.
For anyone considering using the venue, the practical question is whether the exact asset and network they need are available. A broader recovery announcement does not establish every withdrawal route’s status at the moment of use.
Setting up an account during the recovery
If Binance is available in your region and you choose to use it, confirm the relevant service status and displayed account terms first.
Register on Binance with referral code RATE20 →
The link pre-applies RATE20. Review the referral benefit shown during registration; this article does not independently verify a universal fee discount across products, regions or account types. SmallDrift may receive a referral commission.
A decision framework for the next session
The useful question is what would strengthen or weaken the recovery case. Separate observations you can check from explanations that remain speculative.
- Price acceptance: Does Bitcoin stay above the rolling high after testing it, or return inside the range?
- Relative strength: Does Ether retain its lead when BTC pauses, or surrender it during the first pullback?
- Fund demand: Do subsequent completed ETF sessions support the improvement?
- Execution conditions: Are spreads, order depth and the required withdrawal route suitable for the intended transaction?
The last item matters even if your directional thesis is correct. A good market call can still produce a poor result if execution costs overwhelm a small expected move. A limit order controls the worst acceptable execution price, but it may not fill; its maker or taker treatment depends on how it meets the book.
Before placing an order, define the observation that would invalidate the trade and the loss you are prepared to accept. Adjusting that definition after price moves against you is an expensive way to edit a thesis.
For referral mechanics, see Get 20% off with code RATE20, then check the benefit actually displayed for your account. Create a Binance account using RATE20 → if the service and terms fit your needs.
Frequently asked questions
Is Bitcoin above $80,000 on November 5, 2026?
Yes: the retrieved Binance BTC/USDT price was 80,649.35 USDT at approximately 07:01:37 UTC. That is a venue-specific historical observation. Live linked pages will update, and USDT should be distinguished from a direct USD quote.
Does the ETF inflow confirm a Bitcoin trend reversal?
No. A single session cannot establish persistent demand or explain an entire market move. The more useful test is whether later completed sessions and sustained price strength reinforce each other.
What would weaken Bitcoin’s recovery above 80,000?
A rejection near 81,196 followed by a loss of 80,000 and the 79,885 rolling weighted average would weaken the immediate setup. These are conditional observation levels, not guaranteed turning points. They must be refreshed as the rolling window changes.
This article is for informational purposes only and does not constitute financial advice. Always do your own research before making investment decisions.
Get 20% Off Binance Trading Fees with RATE20
New to Binance? Open the official signup page with RATE20 already applied for a 20% trading-fee discount. You do not need to copy or type the code. Review the referral details before completing registration.
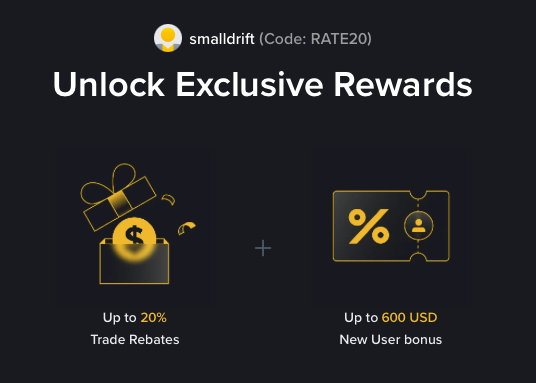
- Referral code: RATE20, pre-applied by this link
- Fee discount: 20%, shown on the Binance signup screen
- Additional rewards: Check Binance for current promotions and regional availability
Be wary of unofficial referral offers promising benefits they cannot show. The Binance signup screen lets you check the code and fee discount directly.
Compare Binance fees and available discounts →
SmallDrift may earn a commission when you sign up through this link. Trading involves risk, including loss of capital.
Related Articles

Explore Related Guides
Daily Crypto Market News
Follow Bitcoin price moves, major altcoins, and the events shaping the market.
Bitcoin ETF Flows Guide
Understand ETF inflows and outflows, and how to read them alongside price action.
Binance Fee Calculator
Learn how to estimate trading costs with referral and BNB discounts.
Verified Binance Referral Guide
See how RATE20 is applied and what to check on the Binance signup screen.