Bitcoin's $643M Demand Test — November 2, 2026
Bitcoin edges up near 78,207 USDT, but Friday’s ETF redemptions and uneven altcoin returns leave the recovery waiting for fresh demand.

Bitcoin is slightly higher even after U.S. spot Bitcoin ETFs recorded $643.2 million in net redemptions on Friday. That sounds reassuring until you notice that Monday’s U.S. fund session has not started and Solana is still losing ground. The useful question on November 2 is whether fresh demand can validate the rebound once more of the market returns.
Research cutoff: November 2, 2026, 07:05:02 UTC. API responses were retrieved around 07:01 UTC. Exchange prices below are Binance spot pairs against USDT, with rolling 24-hour windows ending around November 2 at 07:01:11 UTC, rather than calendar-day returns. ETF figures cover completed U.S. sessions through October 30. Linked market pages show current data; this article preserves a dated snapshot, so later quotes can differ.
What is Bitcoin’s price today?
BTC/USDT was 78,207.19 USDT, up 0.260% in its rolling 24-hour window. Its observed low was 77,620.00 and its high was 78,878.01. That leaves Bitcoin inside its recent range, rather than above a confirmed breakout.
The official Binance market overview provides reader-readable exchange prices. Turnover in the table is quote volume on each individual spot pair, not worldwide trading volume or net investment entering the asset.
| Binance spot pair | Last price, USDT | Rolling 24h change | Rolling low–high, USDT | Pair quote turnover |
|---|---|---|---|---|
| BTC/USDT | 78,207.19 | +0.260% | 77,620.00–78,878.01 | 596.74M USDT |
| ETH/USDT | 2,287.00 | +0.799% | 2,247.84–2,317.84 | 348.36M USDT |
| BNB/USDT | 709.10 | +0.411% | 704.00–717.75 | 76.40M USDT |
| SOL/USDT | 94.53 | -1.140% | 93.18–95.97 | 105.24M USDT |
Bitcoin’s rolling range spans 1,258.01 USDT, about 1.61% of the last price. The last trade sits roughly 46.7% of the way between the low and high. Those are calculations from the saved exchange response, not indicators imported from a chart provider.
The distinction matters. A positive daily percentage can describe a market that is still in the lower half of its recent range. Green text is a comparison with an earlier price, not a certificate of recovery.
Ether is outperforming Bitcoin in this small sample, BNB is modestly positive, and Solana is negative. Four assets do not establish overall market breadth. They do establish that the rebound is uneven, which is a better starting point than assuming every large token has joined the same trade.
Why Friday’s ETF exit still matters on Monday
The latest completed U.S. ETF session showed redemptions; there is no Monday total to interpret yet. Treating weekend Bitcoin trading as evidence that ETF buyers have returned confuses two different markets and two different clocks.
The Farside Bitcoin ETF flow table records these aggregate daily net flows. Values are in millions of U.S. dollars, with positive figures representing inflows and negative figures representing outflows.
| Completed U.S. session | Net flow, USD millions |
|---|---|
| October 26 | +110.3 |
| October 27 | +176.0 |
| October 28 | +137.3 |
| October 29 | +17.2 |
| October 30 | -643.2 |
| Five-session total, calculated | -202.4 |
The earlier four sessions supplied $440.8 million before Friday reversed the week’s balance. That arithmetic is more useful than an isolated scary number: a large redemption day overwhelmed a short run of positive demand.
Still, net ETF flows do not reveal every seller’s motivation. They cannot identify how much selling was prompted by exchange concerns, portfolio rebalancing, or another reason. Nor should dollar redemptions be converted into an exact count of Bitcoin sold using this morning’s spot price. The timing and execution assumptions required for that calculation are unavailable here.
For the next session, watch whether redemptions moderate and whether any improvement persists across subsequent sessions. One positive print would improve the immediate comparison without erasing the preceding withdrawal of capital. A sustained change would offer stronger evidence that demand is rebuilding.
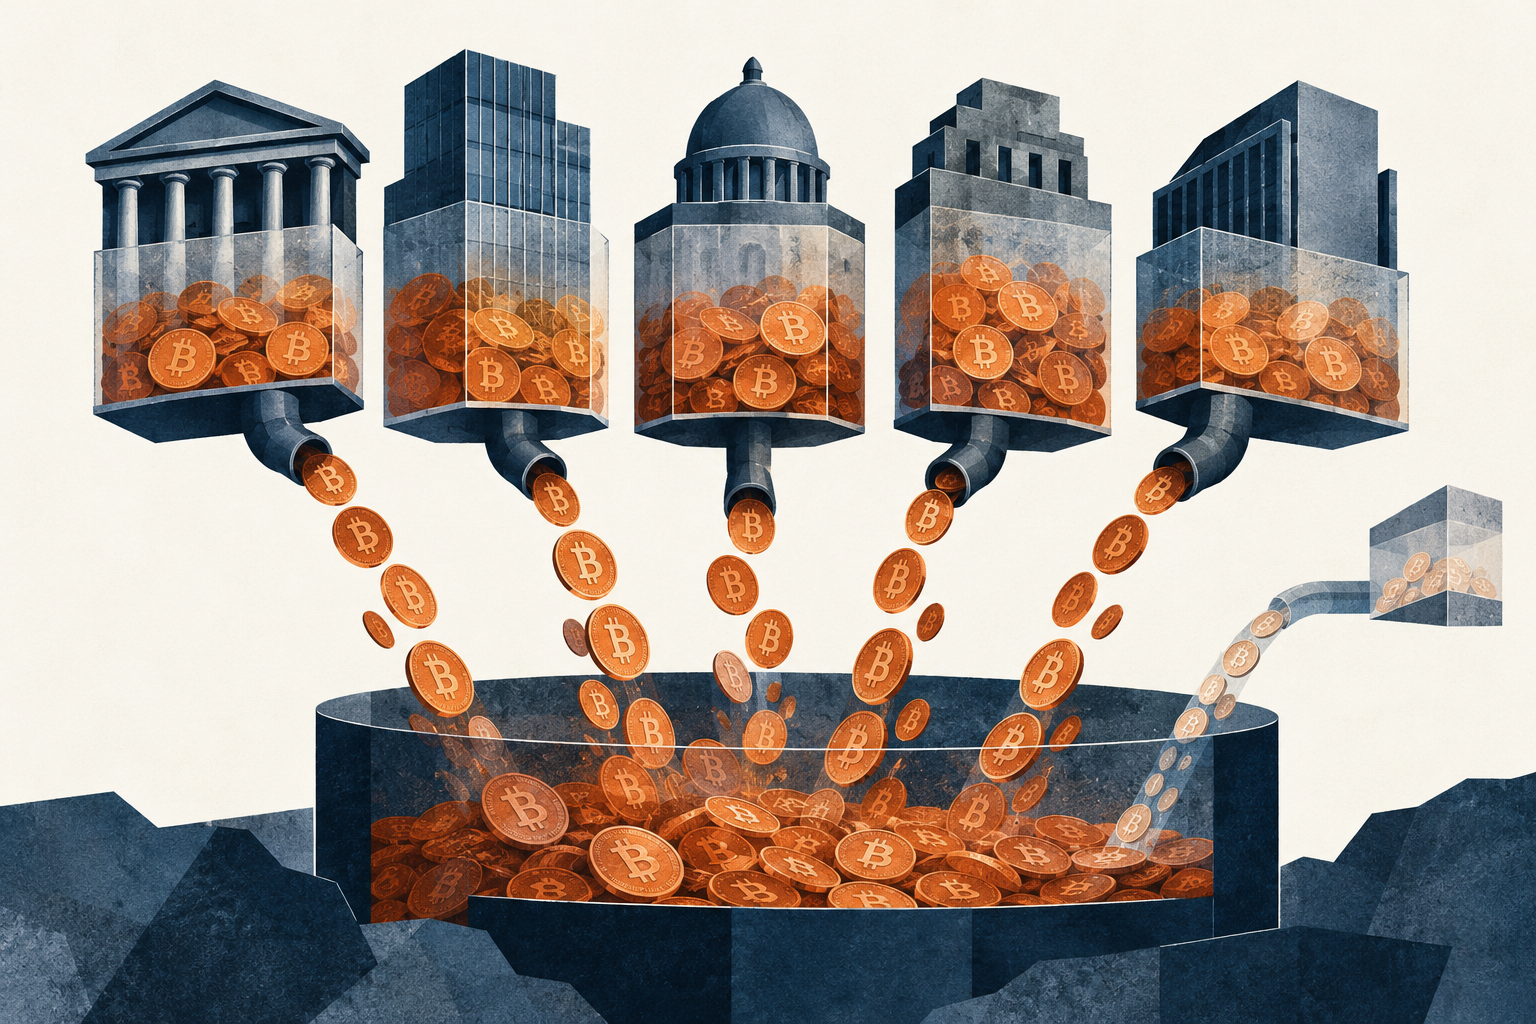
AI-generated editorial illustration of net fund withdrawals; this is not a measured flow chart.
Exchange access and Bitcoin demand are separate tests
Binance’s official November 1 recovery update describes phased withdrawal restoration following the security incident. It says approximately 95% of affected assets had been replenished, identifies the remaining portion as less liquid tokens, and says the company will absorb the loss. Those are company statements, not an independent audit conclusion.
Operational recovery matters because functioning withdrawals let customers move assets again. It does not establish that customers will buy Bitcoin or keep balances on the venue. Access, custody confidence, and investment appetite can improve at different speeds.
A proof-of-reserves snapshot also has a narrower purpose than many headlines imply. Evidence about assets at a particular time does not, by itself, settle every question about liabilities, internal controls, or future withdrawal reliability. Readers should evaluate the scope of any published assurance rather than treating the label as a universal guarantee.
The same caution applies to whale stories. Large exchange wallet movements can reflect customer withdrawals, internal transfers, replacement purchases, or incident-related activity. Without reliable attribution, they do not establish accumulation by long-term investors. This article has no independently verified wallet dataset demonstrating fresh whale buying at the cutoff.
That gap is worth preserving. An honest blank is more useful than a confident invented buyer.
For traders, the practical implication is to check the exact asset and network status before transferring funds. A phased reopening does not mean every route is available at the same moment. A small test transfer can verify an address and route, but cannot guarantee future service availability or eliminate custody risk.
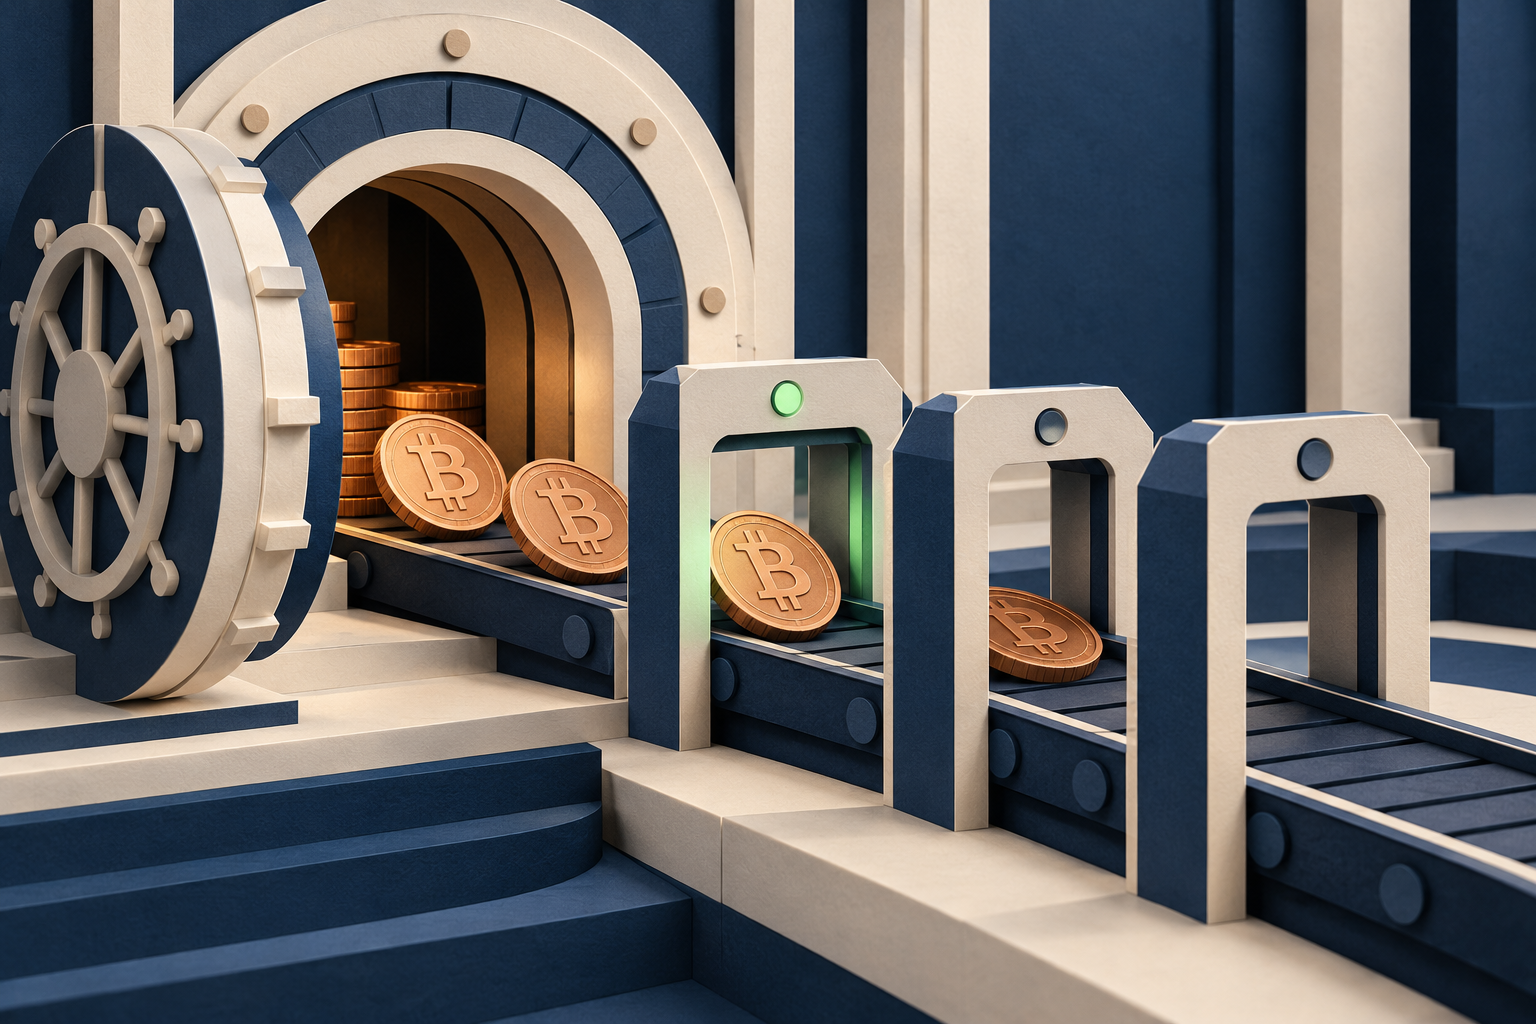
AI-generated illustration of phased access checks, not a depiction of Binance infrastructure.
Does the broader market confirm Bitcoin’s rebound?
The saved global snapshot does not support calling this a broad recovery. CoinGecko’s API response put total crypto capitalization near $2.609 trillion, down 3.443% over its reported 24-hour comparison, with approximately $47.51 billion in reported trading volume and Bitcoin dominance near 60.00%.
The CoinGecko global charts are the official reader-facing reference. The dynamically rendered page returned different headline totals during research, so the figures here specifically refer to the saved API response, whose provider update time was 06:53:32 UTC. We have not substituted the page’s later or differently cached values into that snapshot.
A global capitalization decline can coexist with a small positive move in one exchange’s BTC/USDT pair. The datasets use different asset coverage, pricing inputs, and update times. Their percentages should not be subtracted to manufacture a precise measure of altcoin weakness.
The narrower, defensible conclusion comes from observing them separately: Bitcoin is slightly positive on the measured venue, the four-pair comparison is mixed, and the saved aggregate capitalization measure is negative. That combination calls for selectivity.
For an altcoin rebound to become more convincing, traders would want to see strength spread across more assets and persist beyond a single observation. Higher turnover accompanying gains would add context, although turnover alone cannot distinguish enthusiastic new buyers from short covering or rapid trading between existing participants.
Which Bitcoin levels matter next?
77,620 and 78,878.01 USDT are the immediate observed reference points. They are the rolling low and high from this snapshot, not proven support and resistance derived from a long candle history.
| Reference | BTC/USDT level | Conditional interpretation |
|---|---|---|
| Rolling low | 77,620.00 | Trading below it would extend the measured range downward |
| Snapshot price | 78,207.19 | Baseline for assessing subsequent movement |
| Rolling high | 78,878.01 | Sustained trading above it would improve near-term structure |
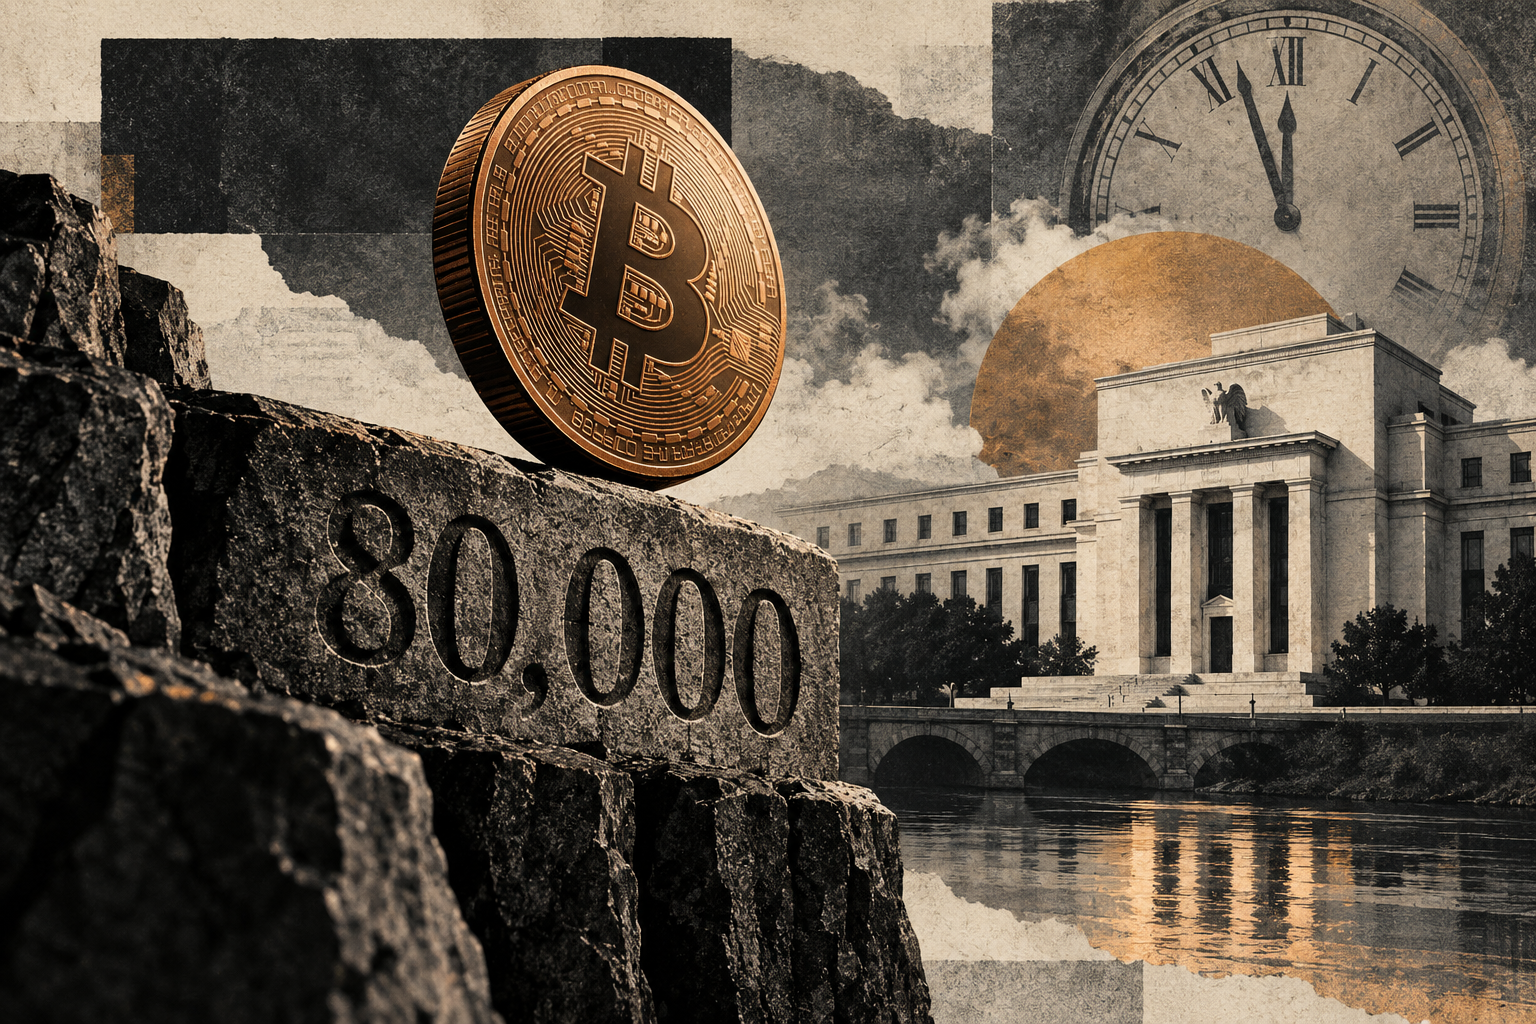
| Round-number watch level | 80,000.00 | Psychological reference, not verified order-book resistance |
The low is about 0.75% below the snapshot price; the high is about 0.86% above it. That proximity makes execution important. A move of less than 1% could change the immediate range narrative without changing the larger demand picture.
A constructive scenario would combine a hold above the observed high with improving participation and better completed ETF flow reports. A weaker scenario would involve a break below the low, persistent redemptions, and continued difficulty restoring confidence. These are conditions to monitor, not probability estimates or price targets.
There is also an unglamorous middle scenario: Bitcoin remains inside the range while operational updates and fund reports arrive. In that case, forcing a breakout thesis would add conviction faster than evidence. Waiting is a position in the decision process, even when it produces no trade.
If you choose to trade, check access before fees
An attractive price is not enough if you cannot use the required network or tolerate the custody arrangement. Check eligibility, account protections, and withdrawal availability before funding an exchange account.
Register on Binance with referral code RATE20 →
The link pre-applies RATE20. Review the displayed referral benefit and applicable terms before registering; this article does not independently verify an account-specific discount. We may earn a commission through this referral link.
For the site’s signup explanation, see Get 20% off with code RATE20. The actual offer shown to your account controls. Fee eligibility can vary, and a potential saving should not outweigh an unresolved access or custody concern.
What would change the market assessment?
The strongest improvement would be agreement among independent observations. A higher Bitcoin price would carry more weight alongside sustained fund demand, broader participation, and reliable exchange access. None of those observations can stand in for the others.
Conversely, another large redemption day would matter more if price also lost the recent low. That combination would suggest buyers were struggling to absorb supply. It would still not identify the sellers or establish a guaranteed next destination for price.
Before acting, define the evidence that would invalidate your view. Consider spread and slippage alongside the posted trading fee, and size any exposure around the possibility that the market moves before an exit order fills. Stop orders can manage a plan, but cannot promise an execution price during gaps or fast trading.
Frequently asked questions
Why is Bitcoin rising after $643.2 million in ETF outflows?
Bitcoin trades continuously, while the cited ETF flow is from Friday’s completed U.S. session. Other buyers and sellers can move price afterward. The small rolling gain does not prove ETF demand has reversed.
What are Bitcoin’s nearby support and resistance levels today?
The saved BTC/USDT rolling range was 77,620.00–78,878.01 USDT. These are observed low and high references. Establishing durable technical support or resistance requires additional history and subsequent price behavior.
Do resumed Binance withdrawals mean market risk is over?
No; withdrawal access and investment demand answer different questions. The company describes a phased recovery. Check the specific asset and network, and distinguish company assurances from independently established evidence.
Create a Binance account with RATE20 →
Review the current referral terms and service availability before completing signup. A fee benefit does not protect against price losses or custody risk.
This article is for informational purposes only and does not constitute financial advice. Always do your own research before making investment decisions.
Get 20% Off Binance Trading Fees with RATE20
New to Binance? Open the official signup page with RATE20 already applied for a 20% trading-fee discount. You do not need to copy or type the code. Review the referral details before completing registration.
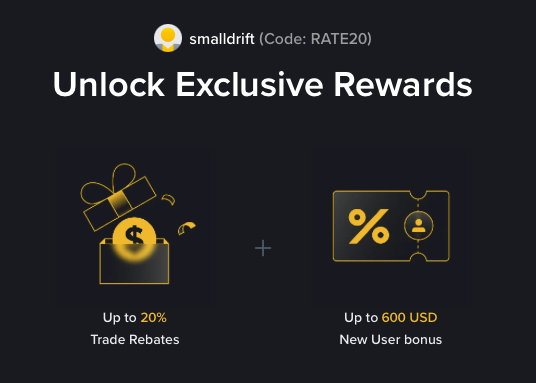
- Referral code: RATE20, pre-applied by this link
- Fee discount: 20%, shown on the Binance signup screen
- Additional rewards: Check Binance for current promotions and regional availability
Be wary of unofficial referral offers promising benefits they cannot show. The Binance signup screen lets you check the code and fee discount directly.
Compare Binance fees and available discounts →
SmallDrift may earn a commission when you sign up through this link. Trading involves risk, including loss of capital.
Related Articles

Explore Related Guides
Daily Crypto Market News
Follow Bitcoin price moves, major altcoins, and the events shaping the market.
Bitcoin ETF Flows Guide
Understand ETF inflows and outflows, and how to read them alongside price action.
Binance Fee Calculator
Learn how to estimate trading costs with referral and BNB discounts.
Verified Binance Referral Guide
See how RATE20 is applied and what to check on the Binance signup screen.