Bitcoin Reclaims $78K: November 1, 2026 Recovery Test
Bitcoin rebounds above 78,000 USDT as Binance plans phased withdrawals. Mixed altcoins and Friday’s ETF outflow leave the recovery unconfirmed.
Bitcoin reclaimed 78,000 USDT, but a green Sunday candle cannot reopen every withdrawal queue. The rebound arrives as Binance lays out a phased return of withdrawals after its security incident, while Friday’s US spot Bitcoin ETF session still shows a substantial exit. The useful question for November 1 is whether improving prices translate into reliable access to funds and sustained buying.
Research cutoff: November 1, 2026, 10:09:42 UTC. Binance spot quotes were retrieved at 10:08:59 UTC. Each pair uses its own rolling 24-hour window ending around that time, rather than a UTC daily candle. Prices are in USDT, not consolidated US dollars. Linked market pages show current data; the figures below are historical research snapshots and will differ as markets move. Generated images are editorial illustrations, not market charts.
What is Bitcoin’s price on November 1?
BTC/USDT traded at 78,150.01, up 0.852% over its rolling 24-hour window. Its recorded low was 77,392.01 and high was 78,285.00. The quote sat roughly 85% of the way through that range: close to the upper boundary, but still inside it.
| Binance spot pair | Last price, USDT | Rolling 24h change | Rolling 24h low | Rolling 24h high |
|---|---|---|---|---|
| BTC/USDT | 78,150.01 | +0.852% | 77,392.01 | 78,285.00 |
| ETH/USDT | 2,271.19 | +1.112% | 2,244.26 | 2,278.00 |
| SOL/USDT | 95.56 | -0.136% | 95.26 | 96.44 |
| BNB/USDT | 712.89 | +1.364% | 702.03 | 716.00 |
The research uses Binance’s spot ticker data; the corresponding reader-readable reference is its official market overview. That page aggregates market information and may display a different quote or volume scope from an individual trading pair.
The modest size of the advance matters. Buyers have improved the immediate position without demonstrating a durable trend change. A market can move toward its recent high because sellers pause, because shorts close, or because new spot demand arrives. A last-traded price alone cannot distinguish those mechanisms.
That is why I would separate the price recovery from the operational recovery. One describes executed trades. The other describes whether a customer can move a particular asset over a particular network. Both matter; neither proves the other.
Why Binance’s withdrawal update changes the question
In its November 1 recovery announcement, Binance scheduled phase one of withdrawals for 06:00–09:00 UTC and described availability as progressive. It reported replenishing approximately 95% of the impacted amount, with less liquid tokens accounting for the remaining 5%. Those are company statements, not an independent verification of reserves or completed withdrawals.
The distinction is practical. A published reopening window does not establish that every customer, token and network has normal service. The announcement directs users to check their selected asset and network and warns that processing delays can occur during rollout. At this cutoff, this article does not independently confirm universal restoration.
AI-generated editorial illustration of phased access; it does not depict the status of any specific withdrawal network.
My reading is that access to funds now deserves as much attention as the price chart. A functioning order book tells you that someone can trade inside the venue. A completed external withdrawal establishes a different capability. During an incident, treating those as interchangeable creates an avoidable blind spot.
For existing users, the relevant check is the actual withdrawal interface and the correct destination network. For observers, the stronger evidence would be sustained processing and a clear account of the incident. A recovery announcement can reduce uncertainty without resolving all of it. Trust has a longer settlement cycle than a trade.
Did ETF buyers return over the weekend?
There is no new Sunday US spot ETF session to establish that. The latest completed trading day in the research is Friday, October 30. Farside’s Bitcoin ETF table records these daily net flows:
| US trading session | Net flow, USD millions |
|---|---|
| October 26 | +110.3 |
| October 27 | +176.0 |
| October 28 | +137.3 |
| October 29 | +17.2 |
| October 30 | -643.2 |
| Week, calculated from those five sessions | -202.4 |
The four positive sessions total $440.8 million. Friday more than erased them. Those figures describe fund creations and redemptions across dated sessions; they do not measure continuous weekend spot demand or explain every price movement.
AI-generated conceptual illustration. Stream widths are not a quantitative scale; use the table for the actual flows.
My inference is that Monday’s demand will be a useful confirmation test. A Sunday rebound can be encouraging before that test exists. It cannot provide its result in advance. Likewise, Friday’s redemptions do not guarantee another negative session when US trading resumes.
There is also no clean causal experiment here. An exchange incident, changing risk appetite and fund flows can overlap. Assigning the entire move to one headline would require evidence beyond a daily tally and a ticker snapshot. The more defensible claim is narrower: price has improved while the most recent fund session remains unfavorable.
What do altcoins say about the rebound?
The four-pair sample shows uneven participation. ETH gained more than BTC in percentage terms, and BNB led this small group. SOL remained slightly negative. That is enough to reject the claim that all major coins are rising together in this observation, but too little to declare an altcoin cycle.
Relative performance is a useful filter because a Bitcoin rebound can hide weakness elsewhere. If gains spread across more assets over several observations, the recovery has broader participation. If one or two coins do the work, the headline can look healthier than the underlying selection of trades.
BNB’s gain also deserves careful interpretation. A token price is a market outcome, not a certification of exchange security. Equally, SOL’s small decline is not evidence that its network has a new problem. The table establishes performance over a defined interval; attaching a narrative requires additional reporting.
For this article, the main signal is the disagreement among the pairs. It keeps the analysis grounded in what was actually observed. Four tickers are a sample, not the whole market wearing a name badge.
Which Bitcoin levels matter next?
78,285 USDT is the immediate observed range boundary; 78,000 is a nearby round-number reference. These are watch points derived from the captured ticker, not independently validated support or resistance. A price can cross either without creating a reliable trading signal.
| BTC/USDT reference | Why it is on the watch list | What would need observation |
|---|---|---|
| 78,285.00 | Captured rolling 24h high | Whether subsequent trading can remain above it |
| 78,000.00 | Round number below the snapshot quote | Whether buyers repeatedly defend the area |
| 77,748.04 | Rolling volume-weighted average price | Whether trading holds above the period’s average execution price |
| 77,392.01 | Captured rolling 24h low | Whether a fresh decline breaks the observed range |
The volume-weighted average comes from the same Binance ticker window. It is not an anchored indicator from the start of the incident, and it is not a moving average calculated from daily closes. Keeping those definitions straight prevents a precise number from pretending to be a stronger signal than it is.
Older on-chain work supplies context rather than a live trigger. Glassnode’s October 21 report placed the True Market Mean near $77,600 and described earlier bids around $80,000. Its underlying series had different October cutoffs. Those historical estimates should not be relabeled as November 1 values.
I would look for repeated acceptance above a reference area, broader spot participation and dependable venue operations before calling the rebound durable. None of those conditions is established by a single print near the top of a one-day range.
Account access comes before a new position
A trading decision during a service recovery starts with whether the venue and withdrawal route meet your needs. Confirm local eligibility, asset availability and the terms shown in your own account before committing funds. Registration itself provides no evidence that a network is ready.
For readers who independently choose Binance, this is our referral link:
Register on Binance with code RATE20 →
The link pre-applies RATE20. Review the displayed referral benefit, eligibility and current fee terms before registration; a discount does not offset market or custody risk. SmallDrift may receive a referral commission.
A practical checklist for the next session
The recovery thesis needs observable follow-through. Here is the sequence I would use to evaluate it:
- Service access: Check the exact asset and network rather than assuming a general announcement covers every route.
- Price acceptance: Watch whether Bitcoin remains above a reference area after crossing it, rather than reacting to one transaction.
- Participation: Compare ETH, SOL and other liquid assets over matching windows so a narrow rebound is visible.
- Fund demand: Review the next reported US ETF session once it exists, allowing for later revisions.
- Position structure: Avoid treating rising price as proof that borrowed exposure has become safer.
The missing data matters too. This research does not include a verified November 1 whale-wallet accumulation series, order-book history or a fresh open-interest dataset. There is no basis here to claim that whales are buying, that a short squeeze is driving the move, or that leverage has cleared.
A large transfer would not settle the issue by itself anyway. It could be a custody movement, internal reorganization or settlement rather than a purchase. Without labels and transaction context, calling every large wallet movement “smart money” is an expensive storytelling habit.
Frequently asked questions
Is Bitcoin above $78,000 on November 1, 2026?
Yes, the captured Binance BTC/USDT quote was 78,150.01 at 10:08:59 UTC. That is a venue-specific USDT snapshot. Live market pages will show later observations, and the dollar symbol in the headline is shorthand for the approximate price area.
Have Binance withdrawals fully resumed?
Universal restoration was not independently verified at the cutoff. Binance announced a phased rollout. Check the chosen asset and network in the official interface; an opening window is not confirmation that every withdrawal route is available.
Does the Sunday rebound prove ETF inflows are back?
No. Sunday spot trading cannot establish the next US ETF session’s flows. The next published fund-session data will provide new evidence. Until then, the rebound and Friday’s redemptions describe different windows and different market mechanisms.
For referral mechanics, see Get 20% off with code RATE20, and verify the offer displayed during signup. That guide explains the promotion; today’s market thesis depends on price, demand and service recovery.
Create a Binance account with RATE20 →
Referral code: RATE20, pre-applied by the link. Benefits depend on the terms displayed to eligible users.
This article is for informational purposes only and does not constitute financial advice. Always do your own research before making investment decisions.
Get 20% Off Binance Trading Fees with RATE20
New to Binance? Open the official signup page with RATE20 already applied for a 20% trading-fee discount. You do not need to copy or type the code. Review the referral details before completing registration.
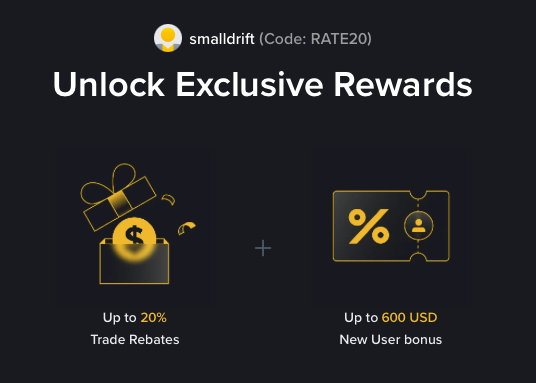
- Referral code: RATE20, pre-applied by this link
- Fee discount: 20%, shown on the Binance signup screen
- Additional rewards: Check Binance for current promotions and regional availability
Be wary of unofficial referral offers promising benefits they cannot show. The Binance signup screen lets you check the code and fee discount directly.
Compare Binance fees and available discounts →
SmallDrift may earn a commission when you sign up through this link. Trading involves risk, including loss of capital.
Related Articles



Explore Related Guides
Daily Crypto Market News
Follow Bitcoin price moves, major altcoins, and the events shaping the market.
Bitcoin ETF Flows Guide
Understand ETF inflows and outflows, and how to read them alongside price action.
Binance Fee Calculator
Learn how to estimate trading costs with referral and BNB discounts.
Verified Binance Referral Guide
See how RATE20 is applied and what to check on the Binance signup screen.