Bitcoin's 80,800 Test: Fragile Floor — October 17, 2026
Bitcoin trades near 81,639 USDT as major altcoins weaken. The rolling low near 80,809 defines the immediate test after another ETF outflow session.

Bitcoin is barely 1% above its rolling 24-hour low, and none of the four major coins in our snapshot is positive. That leaves Saturday’s bounce looking more like a defense of the floor than a recovery with broad backing. The immediate question is whether buyers can protect roughly 80,800 USDT before asking anyone to believe in another breakout.
Research cutoff: October 17, 2026, 07:01:06 UTC. Binance spot tickers were retrieved at 07:00:28 UTC. All pair prices below are in USDT, which is not a guaranteed equivalent of U.S. dollars; changes and volumes cover each pair’s rolling 24 hours, ending around 07:00:28 UTC. ETF figures refer to completed U.S. trading sessions. Linked market pages show current data; this article preserves the snapshot available at the cutoff.
Is Bitcoin holding support near 80,800?
Bitcoin is above its observed rolling low of 80,809.25 USDT, but that alone does not establish durable support. The saved BTC/USDT quote is 81,638.70, down 0.659% over the rolling window. The same window reached 82,940.81 at its high.
The official BTC/USDT spot market provides the live chart corresponding to these exchange-specific figures. At the research quote, Bitcoin sits about 1.03% above the low and 1.57% below the high. It has recovered some ground without reclaiming the window’s opening price of 82,179.99.
That distinction is the article’s central point. A rebound off a low can be real while the market remains weak. Buyers have interrupted the decline; they have not yet demonstrated control of the entire observed range. Calling every interruption a reversal is an expensive habit.
The roughly 80,800 area is therefore a reference for observation, not a prediction that orders will hold there. A rolling low changes as trades enter and leave the window. It is not a completed daily candle low, a volume-profile shelf, or a verified concentration of resting bids. Those would require additional evidence.
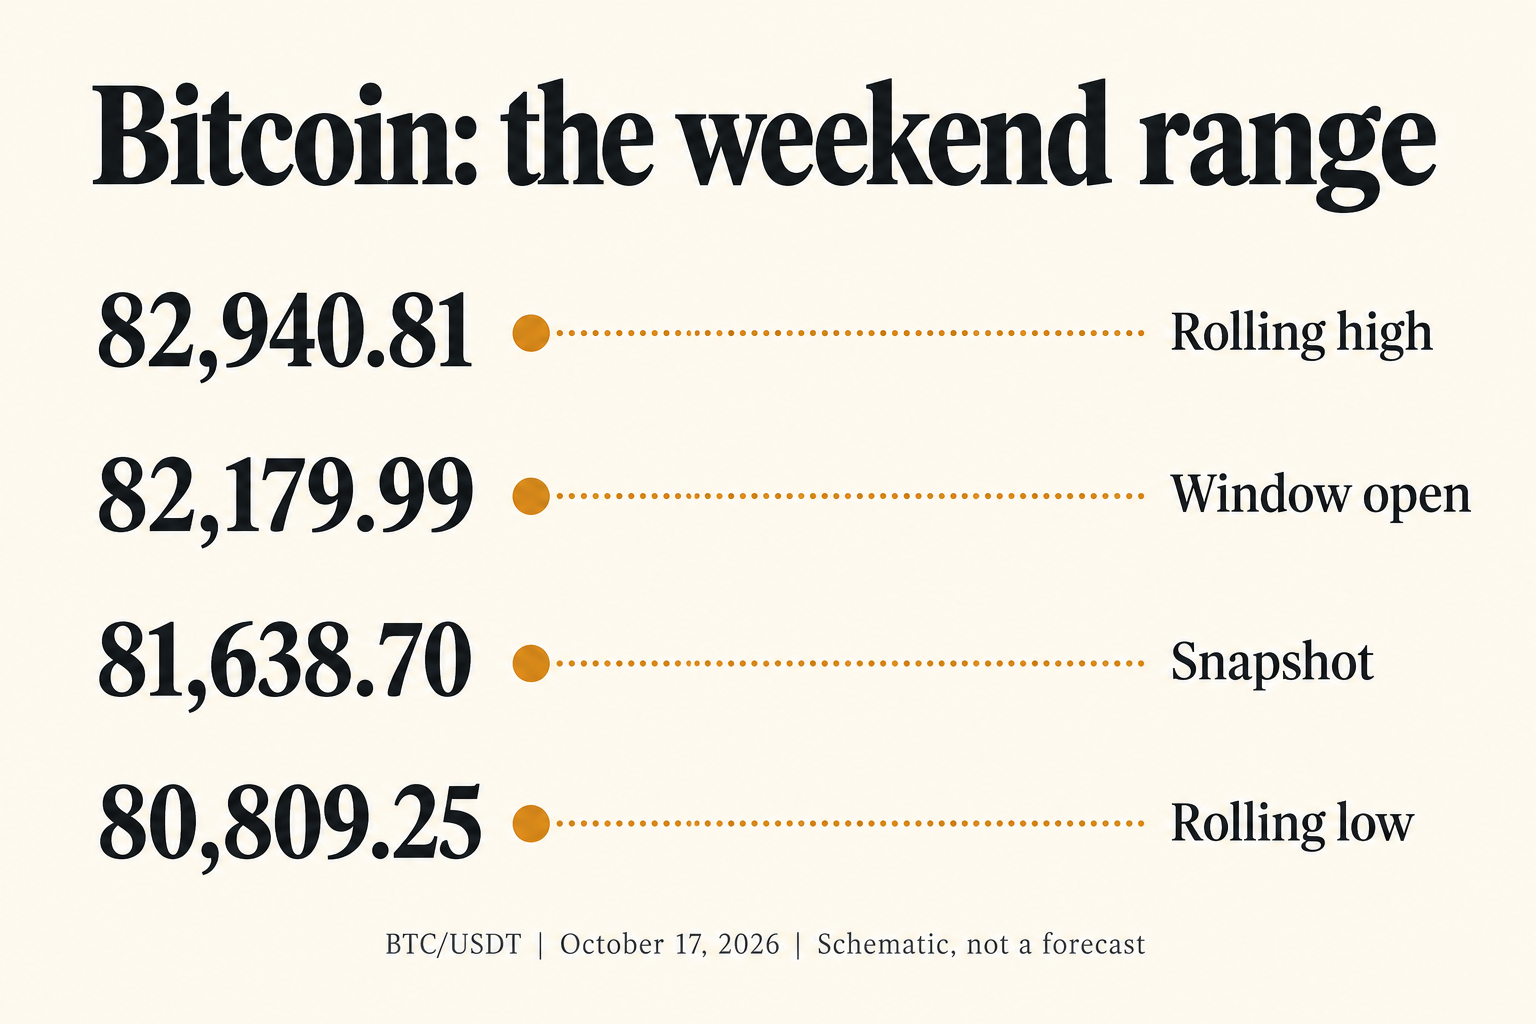
AI-generated explanatory graphic based on the saved Binance snapshot. Levels are schematic, not a proportionally scaled price chart or forecast.
Four major coins show weak breadth
The sampled majors are all lower, with Solana and BNB underperforming Bitcoin. The official Binance market overview offers live context; the figures in this table come from the preserved pair-level response, not an independently refreshed page quote.
| Binance spot pair | Last price, USDT | Rolling 24h change | Pair quote volume, USDT |
|---|---|---|---|
| BTC/USDT | 81,638.70 | -0.659% | 1.078 billion |
| ETH/USDT | 2,433.38 | -0.686% | 640.73 million |
| BNB/USDT | 722.45 | -1.172% | 65.25 million |
| SOL/USDT | 104.96 | -1.307% | 177.00 million |
Quote volume means traded notional on that specific spot pair. It is not global asset volume, new capital entering crypto, or a measure of institutional demand. A buyer and a seller participate in every matched trade; turnover alone cannot tell you which side is building conviction.
The differences are still useful. Ether trails Bitcoin by just 0.027 percentage points, a small gap that should not carry a dramatic narrative. Solana trails by 0.648 points and BNB by 0.513 points. That is a clearer sign of relative weakness within this limited sample.
Four assets cannot stand in for the whole altcoin market. Smaller tokens may be rallying on isolated news, and this table says nothing about how many listed coins advanced. It does show that the most accessible large-cap alternatives are not collectively confirming a strong risk appetite at the cutoff.
For a more convincing recovery, look for participation that lasts through a retest. A brief green print in one token is weaker evidence than several majors holding improved levels while Bitcoin stops revisiting its floor. The sequence matters more than a colorful heatmap refreshed at a convenient moment.
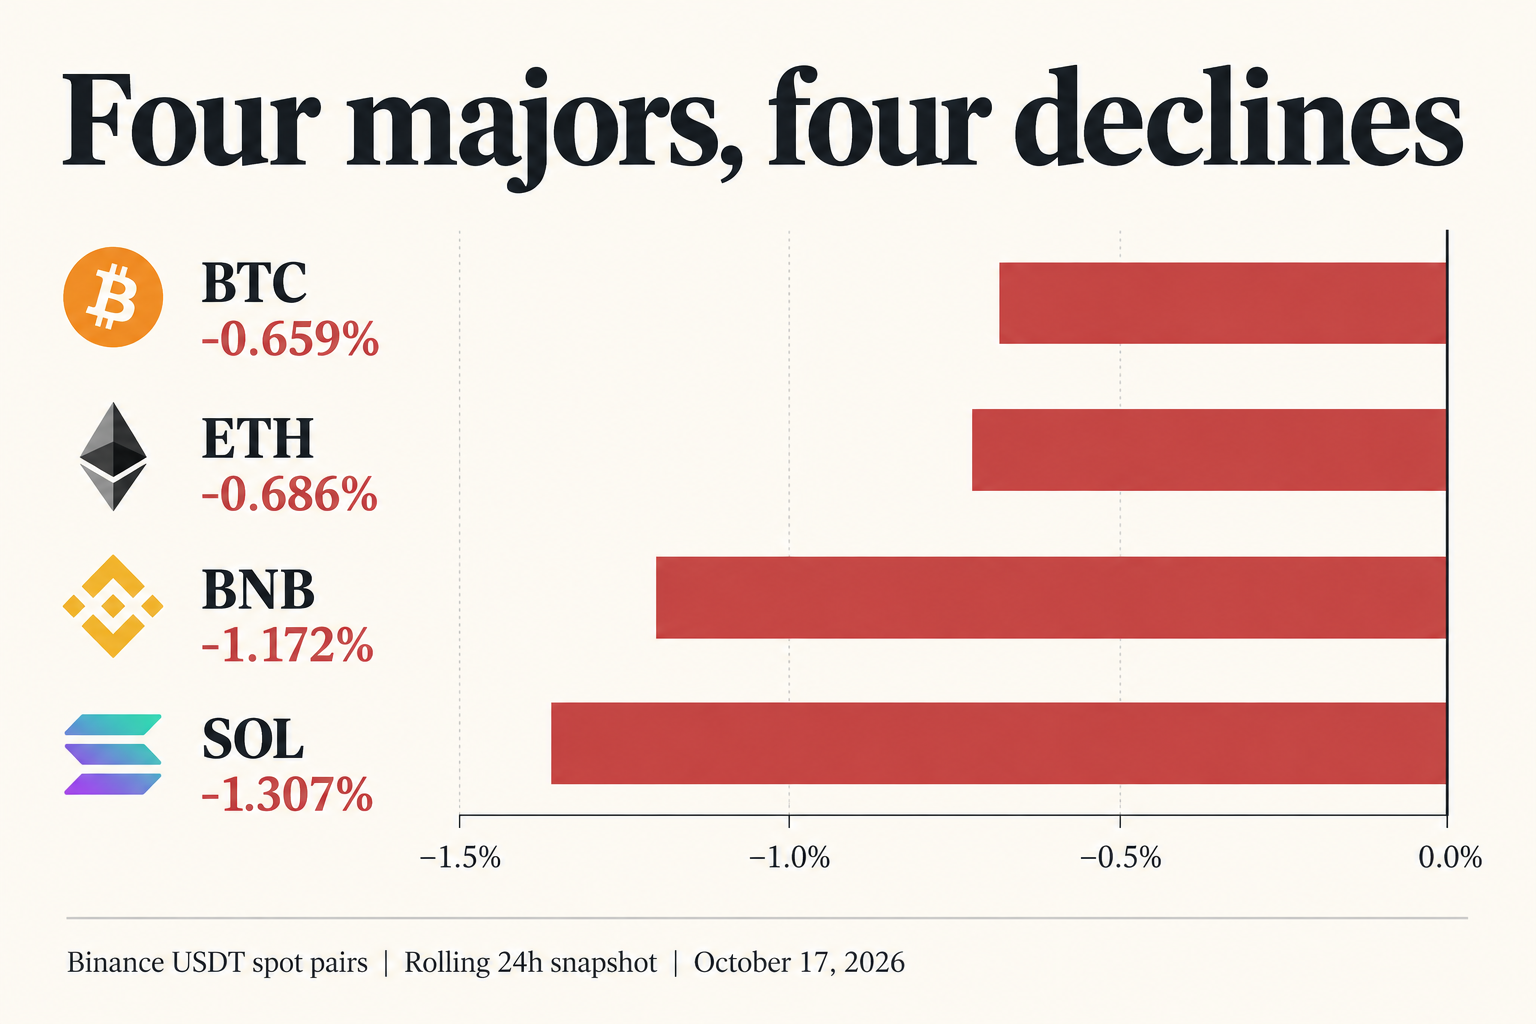
AI-generated comparison using the saved rolling 24-hour changes. This is a four-asset sample, not a market-wide breadth index.
ETF demand has not supplied a clean rescue
Farside’s October 16 row shows an 82.4 million dollar net outflow from U.S. spot Bitcoin ETFs. Its Bitcoin ETF flow table attributes 71.8 million to IBIT and 10.6 million to FBTC, with the other displayed funds at zero. Adding the five displayed daily totals for October 12–16 gives a net outflow of 228.4 million dollars; Tuesday’s inflow did not offset the week’s withdrawals.
These are fund-flow estimates for U.S. trading sessions, not Saturday spot transactions. The table updates and can be revised. The latest completed session is relevant context, but it cannot explain every subsequent move in a continuously traded asset.
The analytical implication is modest: a weekend rebound would begin without a uniformly supportive recent fund-flow backdrop. It could still succeed through other buyers. Conversely, an inflow next session would not automatically repair price structure. Price and fund subscriptions should confirm each other over time before either becomes the entire thesis.
Three levels separate a bounce from a repair
The range offers a practical framework without pretending to forecast the next candle. All references below come from the same ticker window; none is an independently verified order-book wall.
| BTC/USDT reference | Level, USDT | What it can help assess |
|---|---|---|
| Rolling low | 80,809.25 | Whether the observed floor survives another test |
| Rolling opening price | 82,179.99 | Whether the window’s decline is recovered |
| Rolling high | 82,940.81 | Whether price can escape the observed ceiling |
The constructive case starts with the low holding, followed by a move back through the opening reference. A push above the rolling high would then become more interesting if subsequent trades stay above that area and other majors improve. One quick wick is insufficient evidence of acceptance.
The neutral case is continued movement inside the range. That would leave neither a confirmed recovery nor a fresh breakdown. A market does not owe traders a directional answer just because it is Saturday.
The weak case is a loss of the observed floor followed by failure to regain it. That would invalidate this snapshot’s immediate support reference. It would not establish an exact downside target: the round 80,000 level may attract attention, but this research does not verify a bid wall or historical support there.
Distance also matters. From the snapshot quote, the high is roughly 1,302 USDT away and the low about 829 USDT away. These raw distances are not a trade recommendation or a complete reward-to-risk calculation. Actual entry, invalidation, spread, fees and slippage determine the economics of a position.
If you choose to trade the range
Write the invalidation condition before placing an order. Decide whether your idea depends on an intraday reclaim or a completed candle, and avoid silently switching the rule after price moves against you. A limit order can control the execution price but may never fill; an immediately marketable limit order can still take liquidity.
For readers opening an account where Binance is available, review eligibility, products and the referral terms shown during registration.
Sign up on Binance with referral code RATE20 →
The link pre-applies RATE20. Check whether the advertised 20% trading-fee discount is displayed for your account, region and eligible products before completing signup. This is a referral link; SmallDrift may receive compensation. Our guide explains the offer: Get 20% off with code RATE20.
Binance news adds operational checks
The official Binance newsroom lists an October 16 notice supporting the Velodrome Finance token merge to Aerodrome and an AERO contract swap. It also lists upcoming Filecoin and IoTeX network upgrades dated October 19, alongside the announced October 28 delisting of EPIC and QUICK.
These notices matter for holders of the affected assets. They do not establish a reason for Bitcoin’s price move. Anyone moving those tokens should read the individual notice for network availability and timing rather than assume that spot trading, deposits and withdrawals follow identical schedules.
Operational risk belongs in the same notebook as price risk. A correct directional view does not fix a transfer sent through an unsupported network or an order placed without checking an asset’s status.
Keep execution costs in proportion
Small fees can become large through repetition. As an illustration, a hypothetical 0.10% fee on a 1,000-USDT trade costs 1 USDT per side. A conditional 20% reduction would lower that to 0.80 USDT. Buying and selling the same notional would then cost 1.60 USDT before spread and slippage.
That is arithmetic, not a verified universal Binance fee schedule. Account tier, pair, promotions, maker or taker status and payment settings can change the actual charge. Do not assume BNB benefits or futures rates stack identically with a spot referral offer. Read the fee displayed for the product you intend to use.
Saving a fraction of a fee cannot rescue an oversized position through a failed support level. The useful order is thesis, invalidation, position size, then execution cost.
Create your Binance account with RATE20 →
Referral code RATE20 is pre-applied. Confirm the displayed discount and applicable terms during registration.
Frequently asked questions
What is Bitcoin’s key support today, October 17, 2026?
The immediate observed reference is 80,809.25 USDT on Binance BTC/USDT. It is the saved ticker’s rolling low, not proof of durable support. Repeated defense or a failed reclaim would provide more information than the number alone.
Are altcoins confirming a Bitcoin recovery?
The three sampled alternatives do not provide broad confirmation at the cutoff. All are negative over their rolling windows, with BNB and Solana falling more than Bitcoin. A wider breadth survey would be needed to generalize across the full market.
Do Bitcoin ETF flows explain Saturday’s price?
They provide recent demand context, not a direct explanation of every weekend trade. ETF flow figures belong to completed U.S. sessions, while crypto trading continues through the weekend. Treat the two clocks separately when evaluating a rebound.
This article is for informational purposes only and does not constitute financial advice. Always do your own research before making investment decisions.
Get 20% Off Binance Trading Fees with RATE20
New to Binance? Open the official signup page with RATE20 already applied for a 20% trading-fee discount. You do not need to copy or type the code. Review the referral details before completing registration.

- Referral code: RATE20, pre-applied by this link
- Fee discount: 20%, shown on the Binance signup screen
- Additional rewards: Check Binance for current promotions and regional availability
Be wary of unofficial referral offers promising benefits they cannot show. The Binance signup screen lets you check the code and fee discount directly.
Compare Binance fees and available discounts →
SmallDrift may earn a commission when you sign up through this link. Trading involves risk, including loss of capital.
Related Articles



Explore Related Guides
Daily Crypto Market News
Follow Bitcoin price moves, major altcoins, and the events shaping the market.
Bitcoin ETF Flows Guide
Understand ETF inflows and outflows, and how to read them alongside price action.
Binance Fee Calculator
Learn how to estimate trading costs with referral and BNB discounts.
Verified Binance Referral Guide
See how RATE20 is applied and what to check on the Binance signup screen.