Oct. 26, 2026: Bitcoin's $80,000 Test Before the Fed
Bitcoin hovers above $80,000 as late-week ETF outflows weaken a positive weekly total. The price levels and evidence to watch before the Fed meeting.

Bitcoin was just $221 above $80,000 in our October 26 market snapshot. Last week’s US spot ETF total was positive, but the final two reported sessions erased most of the earlier buying. Ahead of the Federal Reserve meeting, that leaves traders with a more useful question than whether Bitcoin is cheap: who will absorb the next wave of selling?
Research cutoff: 2026-10-26 07:01:05.544985 UTC. Prices below are captured Binance spot USDT-pair readings, with rolling 24-hour windows ending around 07:01 UTC on October 26, 2026. ETF figures refer to dated US trading sessions, not the same rolling window. Linked market pages show current data; this article preserves the research snapshot, so their numbers can differ when you visit.
What does Bitcoin’s $80,000 test actually show?
Bitcoin is trading near a psychological threshold, with a recent low below it and no confirmed breakout above the captured range. BTC/USDT last traded at 80,221.06 USDT, down 0.399% over its rolling 24-hour window. Its low was 79,368.67 and its high was 80,951.57.
That is a 1,582.90 USDT range, roughly 1.97% of the last price. A modest closing change can hide a much larger trip between the intraday extremes. Anyone using a tight stop because the headline says “down only 0.4%” is measuring the wrong thing.
These are venue-specific spot observations from Binance, rather than a consolidated global Bitcoin index. USDT quotes are not an assertion that every dollar market traded at exactly the same level. The official Binance market overview provides a readable place to follow the market as it updates.
| Spot pair | Last price, USDT | Rolling 24h change | Rolling 24h low–high | Quote volume, USDT |
|---|---|---|---|---|
| BTC/USDT | 80,221.06 | -0.399% | 79,368.67–80,951.57 | 685.05 million |
| ETH/USDT | 2,325.46 | -0.774% | 2,293.09–2,365.40 | 336.78 million |
| SOL/USDT | 101.26 | -0.158% | 99.88–102.27 | 115.27 million |
| BNB/USDT | 740.36 | -0.302% | 734.08–745.90 | 55.84 million |
The four requests were retrieved seconds apart. Each change measures its own approximately 24-hour window, from October 25 around 07:01 UTC to October 26 around 07:01 UTC. Volumes are for the named Binance pairs only; they are not whole-market turnover.
Bitcoin’s recovery above the round number is encouraging for buyers, but it is a starting condition, not a conclusion. A price can cross $80,000 several times while neither side establishes control. The market does not award points for briefly standing on the right side of a headline.
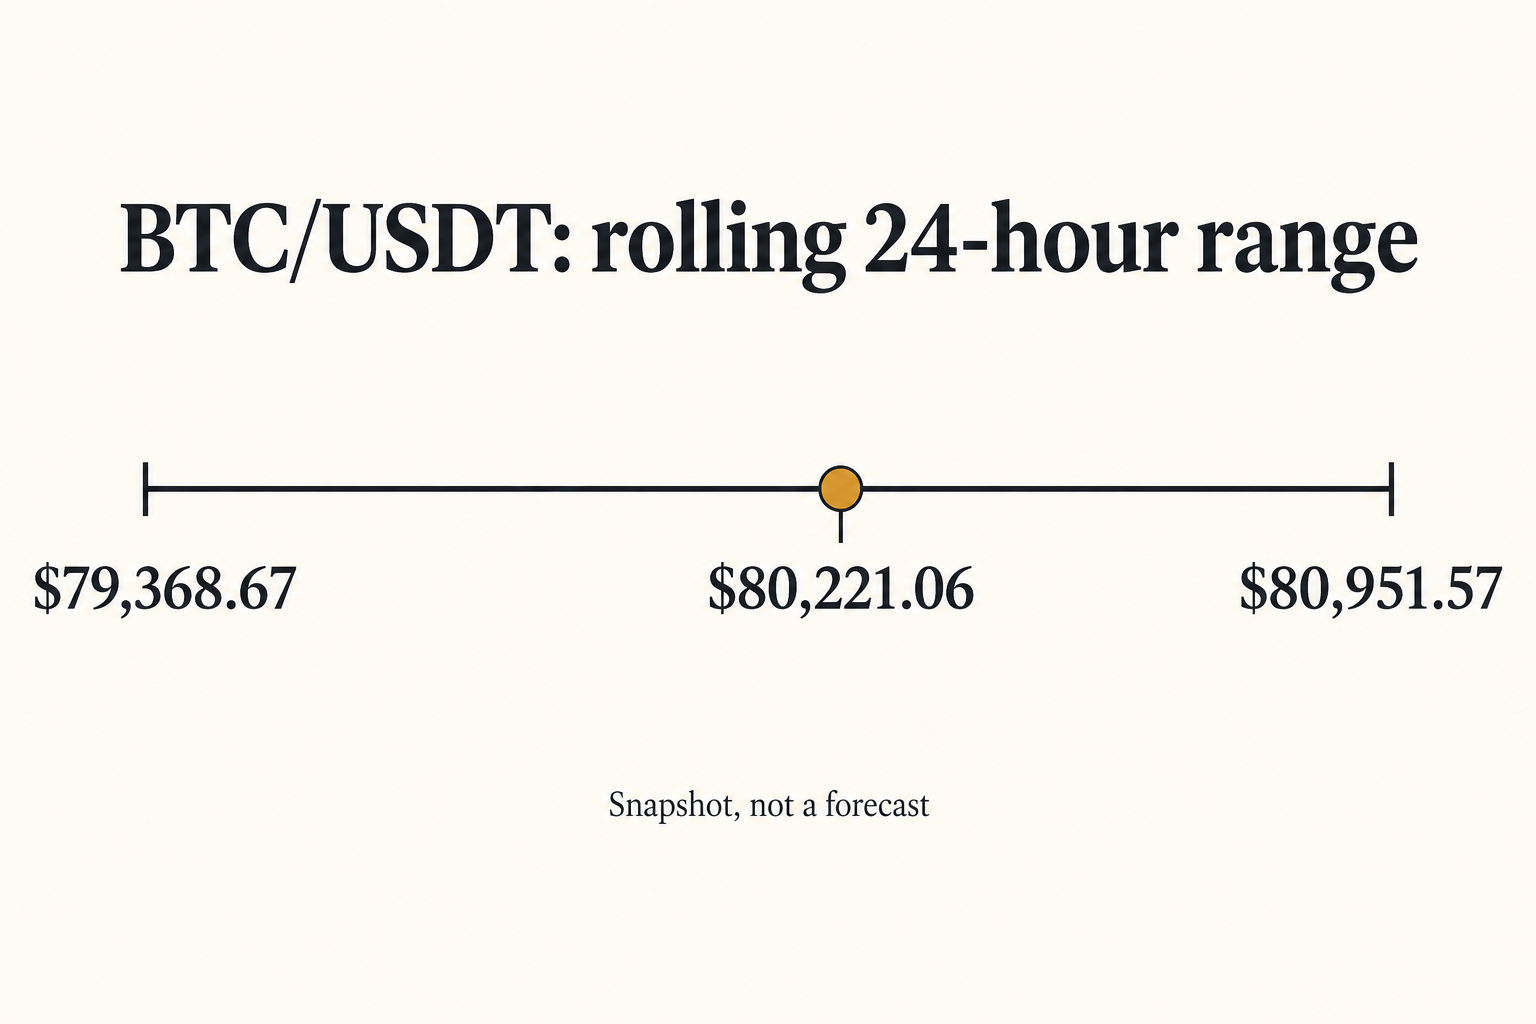
AI-generated illustration of the captured range. The table supplies the exact research figures; this is not a forecast or a live chart.
ETF flows: the weekly total hides the late reversal
The displayed October 19–23 ETF totals sum to a provisional $301.2 million inflow, despite $773.5 million leaving in the final two sessions. That is a mixed demand signal, not an uncomplicated institutional vote of confidence.
The Farside Investors daily flow table showed the following aggregates at research time. Parentheses in the source signify outflows. Friday’s HODL cell was a dash, so its displayed aggregate and the derived weekly sum should be treated as provisional, not as a fully populated final ledger.
| US trading session | Displayed net flow, USD millions |
|---|---|
| October 19 | +526.7 |
| October 20 | +23.2 |
| October 21 | +524.8 |
| October 22 | -635.6 |
| October 23 | -137.9, provisional |
| Five-session sum, calculated | +301.2, provisional |
The first three sessions brought in $1,074.7 million. The next two removed about 72% of that amount. These calculations use the displayed aggregates, which can be revised.
For Monday traders, the distinction matters: a positive weekly number can coexist with deteriorating marginal demand. Conversely, two negative sessions do not establish that every institution has abandoned Bitcoin. Fund creations and redemptions aggregate many decisions, including portfolio rebalancing and hedging.
There is also a clock problem. At this research cutoff, Monday’s US cash session had not opened. Friday’s reported flows therefore cannot tell us what US ETF investors will do on October 26. Crypto trades through the weekend; the US exchange session does not. Treating a stale fund-flow observation as a live buy signal confuses two different markets.
Put the execution plan ahead of the order
If you intend to trade this range, decide the entry condition, invalidation point and maximum loss before entering. Compare the spread and available liquidity with your intended order size. Sitting out an unclear setup is a valid decision.
Sign up on Binance with code RATE20 →
The link pre-applies RATE20. Review the referral benefit, eligibility and fee terms displayed during registration; a discount does not remove spread, slippage or market risk. This is a referral link, and SmallDrift may receive a commission.
The levels worth separating from the noise
The most defensible immediate reference points come from the captured trading range. They are observable prices, although an observed low is not automatically durable support. A broken high can fail just as easily as a broken low can reverse.
| Reference | Level, USDT | Interpretation at the snapshot |
|---|---|---|
| Rolling 24h low | 79,368.67 | Immediate downside reference; sustained trading below would extend the captured range |
| Psychological threshold | 80,000 | Attention point, not proof of a standing buy wall |
| Rolling volume-weighted average | 80,212.39 | Average executed price weighted by base volume within this pair’s window |
| Rolling 24h high | 80,951.57 | Immediate upside reference; acceptance above would improve the short-term picture |
The last price was only about 8.67 USDT above the rolling weighted average. That means the captured price was close to the window’s volume-weighted center, even though it had recovered from the low. It does not tell us whether every buyer is profitable or whether large holders are accumulating.
For slower context, Glassnode’s October 21 report placed the True Market Mean near $77,600 and described overhead supply around $85,000–$87,500. Those are older analytical estimates, not refreshed October 26 order-book readings. They help frame distance and potential supply; they should not be promoted into guaranteed reversal points.
A wallet transfer alone cannot settle the demand question either. Coins arriving at an exchange can support a sale, collateral movement or internal wallet management. This article does not claim a newly verified whale accumulation total. The evidence we captured supports a range test and mixed fund demand, not a story about anonymous smart money rescuing the market.
The Fed is a scheduled risk, not an explanation for every tick
The Federal Reserve’s official calendar schedules the next FOMC meeting for October 27–28. At this cutoff, its decision was still ahead. No outcome is assumed here.
For Bitcoin, the transmission channel is straightforward in principle: shifts in expected rates can affect Treasury yields, the dollar and investors’ willingness to hold volatile assets. The trading result depends on the surprise relative to expectations, not simply on whether the eventual statement sounds friendly.
That is why “the Fed will save support” is not a risk plan. An anticipated decision can already be reflected in prices. A statement that initially produces a rally can be followed by a reversal as participants reassess the details.
Ahead of the meeting, distinguish a setup from a catalyst. The setup is Bitcoin sitting near $80,000 after a late-week ETF reversal. The catalyst is the scheduled policy event. Neither tells you the direction or magnitude of the next move with certainty. Smaller exposure, wider room for normal volatility or no position at all can each be reasonable responses to that uncertainty.

AI-generated conceptual illustration. Separate datasets should be compared with their timestamps and limitations intact.
Altcoins are not delivering a broad confirmation
In the captured pair data, Ether fell more than Bitcoin, while Solana and BNB fell less. That dispersion is useful, but four liquid assets do not establish an altcoin season. Relative resilience over one day is a narrow observation, not a durable leadership ranking.
The captured CoinGecko global response put total crypto capitalization at approximately $2.673 trillion, down 4.229% over its reported 24-hour comparison. Reported global turnover was $50.284 billion, and Bitcoin’s capitalization share was 60.058%.
These values come from the saved API snapshot behind CoinGecko’s global market charts. The live page header returned different figures during research. We preserve the captured API values instead of blending them with the page’s separate update. Global coverage and update timing also differ from Binance’s single-pair windows, so the global decline should not be read as a direct contradiction of BTC/USDT’s smaller move.
The practical takeaway is limited but clear: there is insufficient evidence here for a broad, synchronized risk-on turn. Watch whether strength spreads beyond a few pairs and whether it persists when US markets reopen. One green token is not market breadth.
Binance-specific research also surfaced promotional activity around AI tools and trading competitions. Those product headlines do not establish fresh spot demand for Bitcoin. A reward campaign can attract activity without changing the larger question of who is willing to hold inventory through a policy event.
Fees matter most when you keep changing your mind
Range trading can turn indecision into repeated round trips. Before adding another order, estimate the combined cost of entry, exit, spread and possible slippage. For derivatives, funding and liquidation risk introduce additional costs that a spot fee comparison misses.
The arithmetic is simple: with an assumed 0.10% execution fee on each side, $10,000 of entry notional and $10,000 of exit notional incur $20 in fees before spread or slippage. That is an illustration, not a statement of your account’s current rate. Actual charges vary by product, tier, pair and promotion.
For the signup details, see Get 20% off with code RATE20, and verify the benefit presented to your account. Do not assume referral, BNB-payment and maker benefits automatically stack across all products.
Create your Binance account with code RATE20 →
Frequently asked questions
Is Bitcoin above $80,000 today, October 26, 2026?
It was above $80,000 at the captured snapshot: BTC/USDT last traded at 80,221.06. The same rolling 24-hour window included a 79,368.67 low. This article is a dated observation; the linked market pages show current readings.
Were Bitcoin ETF flows positive last week?
The displayed October 19–23 totals summed to a provisional $301.2 million inflow. The final two sessions showed $773.5 million of combined outflows, and Friday’s table retained a missing HODL entry. The weekly headline therefore needs both a timing caveat and a completeness caveat.
What would strengthen Bitcoin’s short-term setup?
Sustained trading above the captured 80,951.57 high would improve the range picture, especially with renewed spot demand. That is a conditional interpretation, not a price prediction. A move below 79,368.67 would extend the observed downside range; the approaching FOMC meeting could increase volatility in either direction.
This article is for informational purposes only and does not constitute financial advice. Always do your own research before making investment decisions.
Get 20% Off Binance Trading Fees with RATE20
New to Binance? Open the official signup page with RATE20 already applied for a 20% trading-fee discount. You do not need to copy or type the code. Review the referral details before completing registration.
- Referral code: RATE20, pre-applied by this link
- Fee discount: 20%, shown on the Binance signup screen
- Additional rewards: Check Binance for current promotions and regional availability
Be wary of unofficial referral offers promising benefits they cannot show. The Binance signup screen lets you check the code and fee discount directly.
Compare Binance fees and available discounts →
SmallDrift may earn a commission when you sign up through this link. Trading involves risk, including loss of capital.
Related Articles



Explore Related Guides
Daily Crypto Market News
Follow Bitcoin price moves, major altcoins, and the events shaping the market.
Bitcoin ETF Flows Guide
Understand ETF inflows and outflows, and how to read them alongside price action.
Binance Fee Calculator
Learn how to estimate trading costs with referral and BNB discounts.
Verified Binance Referral Guide
See how RATE20 is applied and what to check on the Binance signup screen.