Bitcoin at $79,617: The Fed Test — October 27, 2026
Bitcoin sits near its daily low despite a $110.3M ETF inflow. The October Fed meeting puts the $79,451–$80,845 range under scrutiny.

Bitcoin is only 0.21% above its rolling daily low, even after U.S. spot ETFs recorded a $110.3 million inflow. BTC/USDT traded at 79,617.22 as the Federal Reserve’s October meeting gets underway, leaving buyers with little room for complacency. The immediate question is whether fresh institutional demand can translate into a price recovery before the policy decision changes the conversation.
Research cutoff: October 27, 2026, 07:02:56 UTC. Binance spot responses were retrieved around 07:01:23 UTC, with exchange-reported rolling-window endpoints around 07:01:25 UTC. Those clocks differ slightly; they are preserved separately in the research record. All pair prices below are in USDT, while global capitalization and ETF flows are U.S. dollars. Linked market pages show current data, which can differ from this article’s captured snapshot. ETF figures describe completed U.S. trading sessions, not today’s live buying.
What does Bitcoin at $79,617 tell us?
Bitcoin is trading in the bottom 12% of its captured 24-hour range. The rolling low was 79,451.35 and the high was 80,844.70. The last price stood just 165.87 USDT above that low, compared with 1,227.48 USDT below the high.
That asymmetry matters more than the headline decline of 0.767%. A modest percentage loss can still leave the market poorly positioned if buyers repeatedly fail to lift it away from the floor. Conversely, a bounce from this area would be an observation worth tracking, rather than proof that the broader correction has finished.
The official Binance market overview is the reader-facing reference for the pairs in this snapshot. Its asset summaries may use different aggregation methods from individual spot-pair statistics. The table uses captured Binance pair responses consistently.
| Binance spot pair | Last price, USDT | Rolling 24h change | Rolling low–high, USDT | Quote turnover, USDT |
|---|---|---|---|---|
| BTC/USDT | 79,617.22 | −0.767% | 79,451.35–80,844.70 | 1.209 billion |
| ETH/USDT | 2,303.01 | −0.962% | 2,295.88–2,344.72 | 381.46 million |
| SOL/USDT | 99.52 | −1.738% | 99.46–102.73 | 158.64 million |
| BNB/USDT | 735.08 | −0.739% | 732.45–747.47 | 79.37 million |
The rolling windows extend approximately from October 26 at 07:01:25 UTC to October 27 at 07:01:25 UTC, with small pair-specific differences. Quote turnover measures trading in those particular markets. It does not measure worldwide crypto volume, net capital inflows, or the amount investors have decided to hold.
Every selected pair is negative. SOL is weaker than BTC by 0.971 percentage points, while BNB is roughly matching Bitcoin. This four-pair sample supports a cautious reading of major-coin breadth; it cannot establish what every altcoin is doing.

AI-generated editorial illustration; conceptual, not a market chart.
Which Bitcoin levels matter before the Fed decision?
The first test is the captured 79,451.35 low; the first recovery hurdle is 80,000. These are observation levels derived from the snapshot and a round-number reference. They are not statistically validated support or resistance forecasts.
| Level, USDT | Why it is on the watchlist | What would make it useful |
|---|---|---|
| 79,451.35 | Captured rolling 24-hour low | A sustained break would show sellers extending this range |
| 79,617.22 | Snapshot last trade | Reference point for assessing subsequent movement |
| 80,000 | Round-number threshold above price | Holding above it would provide an initial recovery signal |
| 80,233.00 | Opening price of the captured rolling window | Reclaiming it would erase that window’s price loss |
| 80,844.70 | Captured rolling 24-hour high | Acceptance above it would challenge the immediate range ceiling |
A momentary print above 80,000 would be weaker evidence than repeated trading above it with continued spot participation. Likewise, a brief dip through the low followed by a recovery would differ from price staying beneath it. The distinction is persistence, not the drama of the first candle.
The 80,233 opening reference is specific to this rolling window. It is not the UTC daily open. As the window advances, that reference changes. Treating a rolling statistic as a fixed daily landmark is an easy way to make a chart look more authoritative than it is.
A practical scenario framework follows from those limits. Holding the low and recovering 80,000 would improve the immediate picture. Failing at that threshold would leave the market vulnerable to another floor test. Breaking the low would invalidate the idea that this captured range is containing selling; it would not automatically identify the next destination.
There is no defensible reason to invent a deeper downside target from one ticker response. Sometimes the useful answer is that the available evidence ends here.
Why does the October 27–28 Fed meeting matter?
The meeting creates a scheduled catalyst while Bitcoin is already close to its range low. The Federal Reserve’s official calendar lists the October meeting for October 27–28. At this research cutoff, the meeting’s policy outcome had not occurred.
The calendar establishes timing. It does not establish the probability of a cut, the wording of the statement, or the market’s eventual reaction. This article therefore makes no claim about a verified consensus probability or a guaranteed direction for Bitcoin.
The transmission mechanism is straightforward in principle: policy communication can change expectations for rates and financial conditions, which can alter demand for risky assets. The actual response depends on what investors had already priced in. A seemingly supportive announcement can still disappoint if expectations were more aggressive.
For traders, the risk is not merely choosing the wrong direction. It is assuming ordinary execution conditions will hold during a repricing. Spreads can widen, market orders can execute away from the displayed quote, and a stop order does not guarantee its trigger price as the fill price.
That makes the current low a useful reference, but a poor substitute for a risk plan. A floor observed before a policy announcement has no contractual obligation to survive it. Central banks do not reimburse chart annotations.
Did the $110.3 million ETF inflow change the picture?
It improved the latest reported session, but the buying was concentrated. Farside’s Bitcoin ETF table showed a $110.3 million total inflow for October 26, entirely from IBIT; the other listed funds showed zero. October 22 and 23 had recorded withdrawals of $635.6 million and $137.9 million respectively.
That makes Monday’s positive print useful evidence of demand returning in one vehicle. It does not demonstrate broad participation across issuers, nor reverse the preceding two-session withdrawal total. Reported daily flows can be revised.
ETF subscriptions and redemptions also operate on a different clock from continuous Bitcoin trading. A completed U.S. session’s net flow cannot explain every price move during the following Asian morning. The mismatch is a reason to compare evidence carefully, not force a single cause onto the tape.

AI-generated editorial illustration; the channels represent separate evidence streams, not measured flows.
What about whale accumulation?
Large-wallet stories surfaced in the research search, but no independently verified, current wallet-label dataset was captured for this article. No whale purchase total is therefore included as an established fact.
Even a verified exchange withdrawal would require interpretation. Custody reorganizations, internal transfers and changes in wallet labeling can resemble accumulation. A transaction proves movement; the owner’s motive requires additional evidence. For this setup, repeated spot demand and subsequent ETF reporting offer more inspectable confirmation than an unattributed whale headline.
How weak is the broader crypto market?
The captured global data also showed contraction. CoinGecko’s API snapshot put total capitalization at approximately $2.685 trillion, down 2.432% over 24 hours, with $66.426 billion in reported trading volume and Bitcoin dominance of 59.43%.
The CoinGecko global market charts provide the official live reference. Its rendered page showed different figures during research, so the article retains the captured API values rather than mixing the two observations. Provider updates, caching and coverage can produce differences; the available evidence does not isolate their cause here.
Global capitalization is a valuation estimate, rather than a cash balance. A decline in capitalization does not mean the same dollar amount physically left the market. Similarly, reported turnover counts trading activity; it cannot tell you whether the participants became more optimistic.
The combination of negative major-pair returns and shrinking aggregate valuation is consistent with caution. It does not establish a liquidation cascade, because no current derivatives liquidation dataset was captured. That distinction keeps a weak session from becoming a more dramatic story than the evidence supports.
Check exchange operations before moving funds
Binance’s Ethereum wallet maintenance notice, published October 27, schedules maintenance for October 28 at 06:00 UTC. Ethereum-network deposits and withdrawals are due to pause at 05:55 UTC, with maintenance expected to take about one hour. The notice says trading will remain available.
The transfer interruption is operational news, not evidence of a bearish view on ETH. If a plan depends on moving assets over Ethereum during that window, check the current notice and transfer status first. An estimated maintenance duration is not a guaranteed reopening deadline.
For eligible readers who want to compare account options, review Binance registration with RATE20. The link pre-applies the referral code; inspect the displayed offer and regional eligibility before registering. SmallDrift may receive a referral commission.
Keep execution costs subordinate to the setup
A fee discount can reduce a charge. It cannot rescue a trade entered without a clear invalidation point. Before placing an order, compare the displayed fee, spread, likely slippage and order size; an apparently cheap transaction can become expensive through poor execution.
A limit order controls the price you are willing to accept, but it can remain unfilled. It also does not automatically earn maker treatment: a limit order that immediately crosses the book can execute as a taker. Products and account tiers have different schedules, so no universal effective rate is assumed here.
For the site’s explanation of referral terms, see Get 20% off with code RATE20. Verify the terms shown for your account rather than treating a guide’s example as an entitlement.
Create a Binance account with RATE20 if the service and displayed referral offer suit your circumstances. Availability and benefits depend on the applicable terms.
Frequently asked questions
What is Bitcoin’s price on October 27, 2026?
The captured Binance BTC/USDT last price was 79,617.22 around 07:01 UTC. It was down 0.767% over the pair’s rolling 24-hour window. This is a timestamped exchange observation, not a full-day closing price or a universal dollar quote.
What are Bitcoin’s key support and resistance levels today?
The captured rolling low of 79,451.35 and high of 80,844.70 frame the immediate watchlist. The 80,000 round number and 80,233 rolling-window open sit between them. These are conditional reference points; subsequent trading can invalidate the range.
Are Bitcoin ETFs buying ahead of the Fed meeting?
Farside showed a $110.3 million inflow for October 26, concentrated in IBIT. That completed-session observation does not establish October 27 flows or predict the October 28 policy reaction. More issuer participation and price strength would improve the evidence for a durable recovery.
This article is for informational purposes only and does not constitute financial advice. Always do your own research before making investment decisions.
Get 20% Off Binance Trading Fees with RATE20
New to Binance? Open the official signup page with RATE20 already applied for a 20% trading-fee discount. You do not need to copy or type the code. Review the referral details before completing registration.
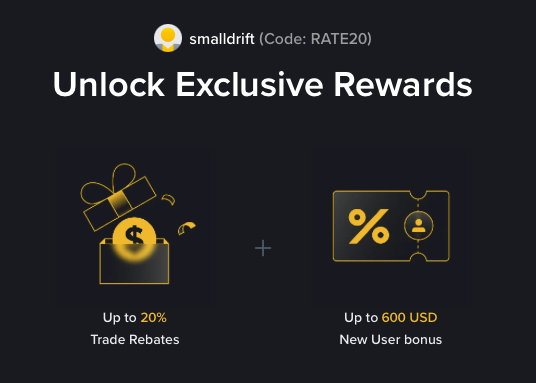
- Referral code: RATE20, pre-applied by this link
- Fee discount: 20%, shown on the Binance signup screen
- Additional rewards: Check Binance for current promotions and regional availability
Be wary of unofficial referral offers promising benefits they cannot show. The Binance signup screen lets you check the code and fee discount directly.
Compare Binance fees and available discounts →
SmallDrift may earn a commission when you sign up through this link. Trading involves risk, including loss of capital.
Related Articles



Explore Related Guides
Daily Crypto Market News
Follow Bitcoin price moves, major altcoins, and the events shaping the market.
Bitcoin ETF Flows Guide
Understand ETF inflows and outflows, and how to read them alongside price action.
Binance Fee Calculator
Learn how to estimate trading costs with referral and BNB discounts.
Verified Binance Referral Guide
See how RATE20 is applied and what to check on the Binance signup screen.