Bitcoin at $73,628: The ETF Test on November 12, 2026
Bitcoin is nearly flat but sits near its rolling low as ETF withdrawals continue. BTC, ETH and SOL benchmarks reveal what a recovery needs.

Bitcoin is up just 0.034%, yet it sits only 16.7% of the way up its rolling 24-hour range. At 73,627.95 USDT, the headline change looks quiet; the position inside that range looks considerably less comfortable. With another reported ETF withdrawal and uneven altcoin participation, today’s question is whether buyers can recover lost ground rather than simply defend the floor.
Research cutoff: 2026-11-12 07:02:52 UTC. Prices below are historical snapshots collected around 07:01 UTC on November 12, 2026. Linked market pages show current data, which can differ from this article. Spot pairs are quoted in USDT, not guaranteed US dollars; rolling windows are not UTC calendar-day candles.
What is the crypto market doing on November 12?
Bitcoin is effectively flat, while all three sampled spot pairs trade in the bottom fifth of their own rolling ranges. That is the useful distinction in today’s tape. A small positive percentage tells you how the last trade compares with the price one day earlier. It does not tell you whether the market retained its intervening gains.
The table uses Binance spot tickers, with rolling 24-hour windows ending November 12 at 07:01:33–07:01:34 UTC. Quote volume is turnover in USDT on the specified pair, not worldwide trading volume. The corresponding official Binance market overview lets readers inspect the live market; its aggregated displays need not match these single-pair snapshots.
| Spot pair | Last price, USDT | Rolling 24h change | Rolling low–high, USDT | Pair quote volume |
|---|---|---|---|---|
| BTC/USDT | 73,627.95 | +0.034% | 73,390.13–74,811.45 | 1.007 billion USDT |
| ETH/USDT | 2,049.02 | −0.339% | 2,035.83–2,103.78 | 363.83 million USDT |
| SOL/USDT | 82.90 | +0.363% | 82.19–85.85 | 145.17 million USDT |
The calculation is straightforward: subtract the low from the last price, then divide by the high minus the low. Bitcoin’s reading is 16.7%; Ethereum’s is 19.4%; Solana’s is 19.4%. Those are positions within observed ranges, not probabilities of a bounce.
One limitation matters: three major pairs are a deliberately small sample. They cannot establish how every token is trading. They do establish that the modest green readings in Bitcoin and Solana coexist with prices well below their latest rolling highs. Green ink can conceal a disappointing afternoon.
Bitcoin’s first test is 74,036, not a distant price target
The immediate recovery reference is the sampled rolling volume-weighted average near 74,036.53 USDT. This is the average execution price weighted by traded quantity over the ticker window. It is a descriptive benchmark, not a magical support line or a prediction.
Bitcoin was about 0.55% below that average at collection. It was only 237.82 USDT above its rolling low, while the distance to its rolling high was 1,183.50 USDT. That asymmetry explains why a flat daily return deserves a second look: considerably more of the observed range lies overhead than below the last trade.
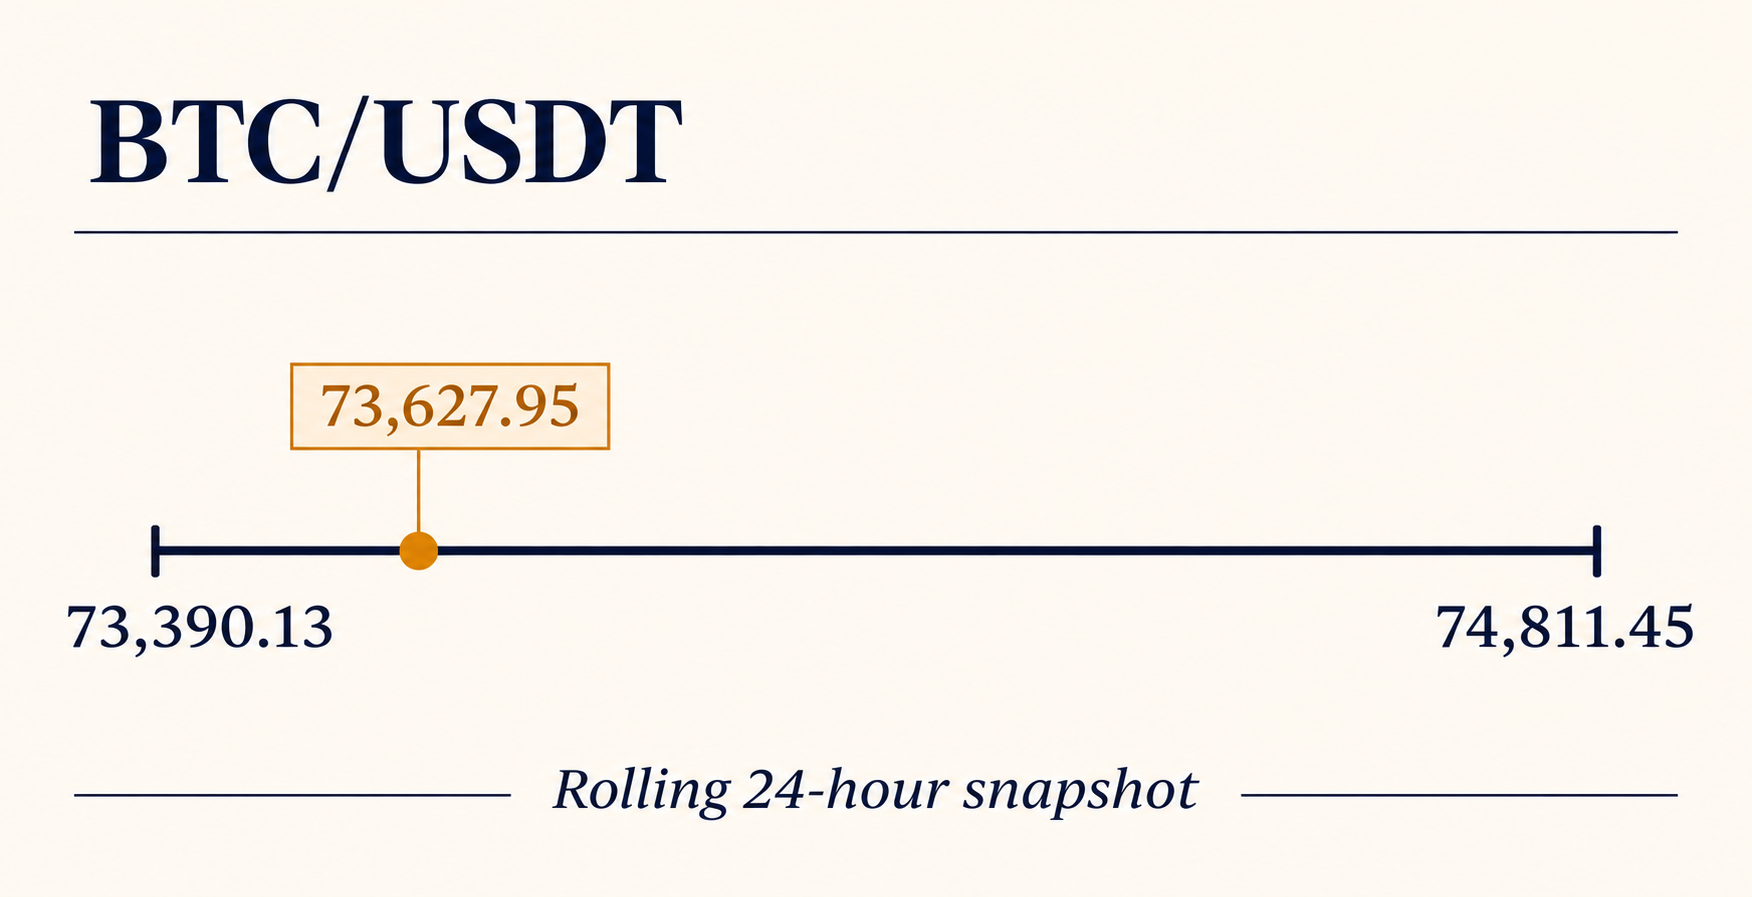
AI-generated explanatory graphic. The table and calculations provide the authoritative figures; this is not a reconstructed intraday price chart.
| BTC/USDT reference | Level, USDT | Interpretation |
|---|---|---|
| Sampled rolling low | 73,390.13 | First observed downside reference |
| Snapshot last trade | 73,627.95 | Starting point for this analysis |
| Rolling weighted average | 74,036.53 | First recovery benchmark |
| Sampled rolling high | 74,811.45 | Upper boundary of this observed window |
These levels come from one rolling ticker response. Calling the low “support” means it is a level to watch for renewed buying, not that repeated historical tests have been verified. Calling the high “resistance” means it is the nearest observed upper boundary, not a confirmed multiweek ceiling.
A constructive sequence would be a recovery above the weighted average followed by sustained trading toward the high. A weaker sequence would be repeated failures below that average and another visit to the low. A brief wick through either boundary would require fresh data before it could support a stronger conclusion.
There is no responsible way to derive an RSI, moving-average crossover, or daily closing signal from this ticker alone. Those require a candle series with a defined interval. The absence of those indicators is a limit on the evidence, not an invitation to fill the space with confident adjectives.
ETF withdrawals remain a separate demand problem
Farside’s latest available table reports a $299.8 million net outflow for November 11. The US spot Bitcoin ETF flow table shows a $269.7 million withdrawal from IBIT and $39.1 million from GBTC, partly offset by $9 million entering MSBT. The other displayed fund entries are zero.
Across November 2–11, the eight displayed sessions sum to approximately $1.878 billion in net outflows. Seven are negative; November 4 is the lone positive session at $74.6 million. November 11 therefore extends the visible withdrawal run to five consecutive sessions. These totals use the provider’s rounded million-dollar entries and remain subject to revision.
The newest session is more negative than November 10’s $95 million withdrawal. That does not tell us exactly when associated execution occurred, which venue absorbed it, or how much of today’s price movement it caused. ETF flows describe fund demand over a US reporting session. Our spot ticker describes a continuously traded pair over a different window.
The key analytical mistake would be to interpret flat Bitcoin as proof that institutional selling has ended. A market can absorb withdrawals while going sideways; it can also pause before moving lower. The price response and the flow report answer different questions. Neither cancels the other.
Equally, one positive ETF day would be an improvement rather than automatic evidence of a durable reversal. What matters next is whether a sequence of better reports accompanies firmer spot trading. A single number makes a headline. Persistence makes a stronger case.
Whale accumulation offers a counterweight, with limits
Glassnode’s November 11 on-chain report describes accumulation in the 100–1,000 BTC and 1,000–10,000 BTC cohorts over seven days through November 9, while other cohorts were reducing balances. It also places the short-term holder cost basis at about $75,600 and reports a $14.2 billion contraction in stablecoin supply over 30 days.
Those are earlier-window research observations, not November 12 live measurements. Taken together, they suggest selective buying against a difficult liquidity backdrop. They do not establish an amount of whale purchases that can be subtracted from ETF withdrawals. Nor does a wallet-size band identify the beneficial owner behind every address.

AI-generated conceptual illustration. The separate channels do not imply equal quantities, shared owners, or matching observation periods.
For this article, the whale signal is a reason to resist a one-sided bearish story, not a sufficient reason to declare a bottom. Concentrated accumulation could persist and broaden. It could also fade before the rest of the market joins in.
A trader following this tension needs two checks: whether the next on-chain report still shows accumulation, and whether observed spot prices begin recovering their own benchmarks. Without the second, the first is an interesting ownership development rather than a trade trigger. Buying by someone with a longer horizon does not set your holding period.
ETH and SOL have the same recovery problem
Ethereum’s −0.339% reading makes it the weakest of the three pairs by rolling percentage change. Solana’s +0.363% makes it the strongest. Yet both sit around 19.4% of the way up their ranges. Their ranking by daily return disguises a similar position relative to recent extremes.
Their weighted averages reinforce that point. ETH’s rolling average is 2,065.42 USDT, about 0.79% above its last price. SOL’s is 83.94 USDT, roughly 1.26% above its last price. All three sampled pairs therefore trade below the average price at which their window’s volume changed hands.
That is not evidence that every participant is losing money: traders entered at different times, used different instruments, and may have hedges. It does mean the last execution is below the window’s volume-weighted benchmark. For a recovery thesis, reclaiming that benchmark across several assets would be more persuasive than one token briefly outperforming.
CoinGecko’s global API snapshot adds context: about $2.458 trillion in total capitalization, down 3.364% over its reported 24-hour period, and $61.85 billion in reported volume. Its update time was 06:55:33 UTC. However, the official global market charts page returned different headline figures during this research pass. We preserve the API response and disclose that discrepancy rather than substitute the page’s figures or claim synchronized agreement.
The API and rendered page should therefore be read as separate observations. The global aggregate also covers a broader asset universe than the three Binance pairs. A flat BTC/USDT ticker and a declining global total are not inherently contradictory, and they should not be forced into one identical market return.
Binance’s scheduled launches are not Bitcoin inflows
Binance’s official TradFi perpetual-contract notice schedules NUUSDT for November 12 at 09:30 UTC and FRHCUSDT at 09:45 UTC. Their underlying equities are Nu Holdings and Freedom Holding. Both contracts settle in USDT and list maximum leverage of 20x.
At this article’s research cutoff, those launch times were still ahead. This is a scheduled product expansion, not confirmation of completed launches or new buying of Bitcoin. More trading instruments can increase choice without increasing demand for the asset being analyzed here. Eligibility also varies by region.
Keep execution costs separate from the market thesis
A narrow-range setup leaves less room for spreads, commissions, and poor fills. If you choose to open an eligible account, check the displayed referral terms before registration and compare the applicable fee schedule with your expected trade size.
Review Binance signup with referral code RATE20 →
The link pre-applies RATE20. Verify any advertised 20% referral fee discount in the registration flow; availability and qualifying products depend on the terms shown for your account. The link is a referral link, and SmallDrift may receive compensation.
For the site’s signup explanation, see Get 20% off with code RATE20. A discount is a cost consideration, not evidence that this market deserves a position. BNB payment discounts, maker rates, and futures commissions are distinct settings; this article does not assume they stack into a guaranteed effective fee.
What would change today’s assessment?
Three developments would strengthen a recovery case: Bitcoin reclaiming its sampled weighted average, ETH and SOL recovering their corresponding benchmarks, and subsequent ETF reports showing less persistent withdrawals. None requires guessing the exact low in advance.
The weaker case would combine a break below the sampled lows with continued fund withdrawals and a failure of the narrow whale signal to broaden. Those observations would still need their own timestamps. Today’s range will roll forward; old levels should not be presented as freshly measured support tomorrow.
This leaves a practical distinction between monitoring and prediction. The evidence supports watching a fragile lower-range market. It does not support a guaranteed bounce, a specific liquidation cascade, or an inevitable return to a round-number target.
Frequently asked questions
What is Bitcoin’s price on November 12, 2026?
The captured Binance BTC/USDT last price was 73,627.95 USDT at 07:01:33 UTC. It was up 0.034% over that ticker’s rolling 24-hour window. Live market pages can show different values as prices and reporting windows change.
What are Bitcoin’s immediate support and resistance levels?
The sampled rolling low was 73,390.13 USDT and the high was 74,811.45 USDT. The rolling weighted average at 74,036.53 USDT is an intermediate recovery reference. These are descriptive levels from one snapshot, not independently confirmed historical support or resistance.
Did Bitcoin ETFs have inflows or outflows?
Farside’s available November 11 row showed $299.8 million in net outflows. The displayed November 2–11 sessions sum to roughly $1.878 billion withdrawn. These are US fund-session reports, distinct from the continuously rolling spot-price window and the older whale observations.
Create a Binance account with RATE20 →
Review the referral details, regional eligibility, and applicable fees before completing registration.
This article is for informational purposes only and does not constitute financial advice. Always do your own research before making investment decisions.
Get 20% Off Binance Trading Fees with RATE20
New to Binance? Open the official signup page with RATE20 already applied for a 20% trading-fee discount. You do not need to copy or type the code. Review the referral details before completing registration.

- Referral code: RATE20, pre-applied by this link
- Fee discount: 20%, shown on the Binance signup screen
- Additional rewards: Check Binance for current promotions and regional availability
Be wary of unofficial referral offers promising benefits they cannot show. The Binance signup screen lets you check the code and fee discount directly.
Compare Binance fees and available discounts →
SmallDrift may earn a commission when you sign up through this link. Trading involves risk, including loss of capital.
Related Articles



Explore Related Guides
Daily Crypto Market News
Follow Bitcoin price moves, major altcoins, and the events shaping the market.
Bitcoin ETF Flows Guide
Understand ETF inflows and outflows, and how to read them alongside price action.
Binance Fee Calculator
Learn how to estimate trading costs with referral and BNB discounts.
Verified Binance Referral Guide
See how RATE20 is applied and what to check on the Binance signup screen.