Bitcoin Holds $76K After $1.28B ETF Exit: November 7, 2026
Bitcoin trades near $76,056 after a $1.28 billion weekly ETF outflow. The weekend range offers a test of whether the rebound has real staying power.

US spot Bitcoin ETFs lost a net $1.2817 billion over November 2–6, yet Bitcoin is back above 76,000 USDT this morning. The rebound is only 0.464% over the captured rolling 24 hours, hardly a declaration that selling has finished. For weekend traders, the useful question is whether price can hold its recovery while a major source of demand is withdrawing capital.
Research cutoff: November 7, 2026, 07:01:36 UTC. Exchange snapshots were retrieved at approximately 07:00:41 UTC. All pair prices below are Binance spot quotes in USDT, with changes, ranges and volumes covering each ticker’s rolling 24-hour window ending around that retrieval time. They are not calendar-day closes or consolidated global prices. Linked market pages show current data and may differ from this historical snapshot. ETF figures refer to dated US trading sessions and can be revised.
What does Bitcoin’s $76K rebound actually show?
It shows buyers defending part of the recent trading range; it does not establish a new uptrend. BTC/USDT last traded at 76,056.10, above a rolling low of 74,888 but below the same window’s high of 76,378.
The distance to the high is only about 0.42%. The distance back to the low is about 1.54%. Those are descriptive distances from the snapshot, not probabilities or expected returns. A small upward move could challenge the range ceiling, while a return to the low would surrender substantially more ground.
| Binance spot pair | Last price, USDT | Rolling 24h change | Rolling low–high, USDT | Pair quote volume, USDT |
|---|---|---|---|---|
| BTC/USDT | 76,056.10 | +0.464% | 74,888–76,378 | 1.151 billion |
| ETH/USDT | 2,246.70 | +0.848% | 2,210–2,254.26 | 416.91 million |
| SOL/USDT | 90.25 | +0.692% | 89.15–91.62 | 127.05 million |
| BNB/USDT | 694.69 | +0.668% | 686.51–699.51 | 50.67 million |
Use the official Binance market overview for live context. The table uses captured single-pair ticker responses; overview pages can use different aggregation and update schedules. In particular, the volume above measures trading in each named pair, not every venue trading that asset.
All four pairs are positive in their respective windows. That is a modest sign of breadth, but four large tokens are a small sample. Calling it an altcoin season would be asking a very short guest list to represent the entire party.
ETF investors withdrew $1.28 billion in five sessions
The Farside Investors flow table reports the following daily totals. Adding the five published rows produces the weekly number in this article’s title.
| US trading session | Net Bitcoin ETF flow, USD millions |
|---|---|
| November 2 | -398.6 |
| November 3 | -115.6 |
| November 4 | +74.6 |
| November 5 | -430.2 |
| November 6 | -411.9 |
| November 2–6 total | -1,281.7 |
Friday’s outflow included $403.0 million from IBIT, partly offset by $42.8 million entering FBTC. Thursday and Friday together accounted for $842.1 million of net redemptions. Wednesday’s positive session therefore did little to repair the week’s balance.
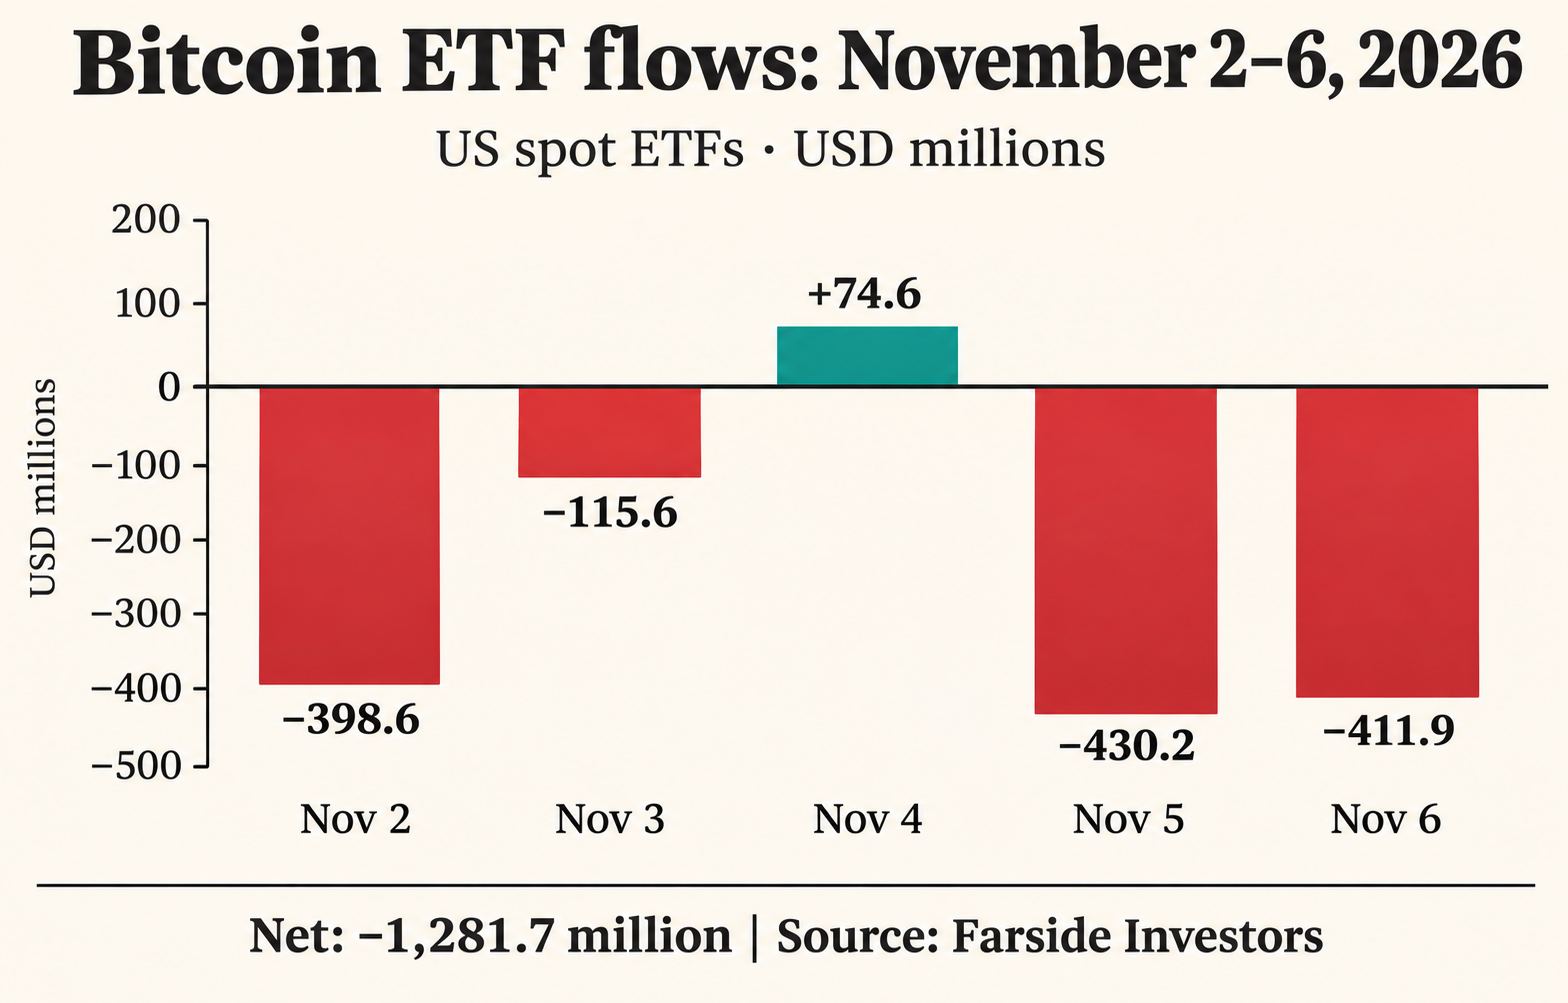
AI-generated explanatory graphic using the daily totals above; the table is the numerical reference.
The implication is a demand headwind. It is not a mechanical forecast that Bitcoin must fall by an equivalent dollar amount. ETF creations and redemptions interact with inventory, hedging and other participants, while market capitalization changes reflect marginal pricing. Subtracting fund outflows directly from Bitcoin’s market value would confuse different quantities.
Nor does a negative aggregate mean every institution sold. Fund-level differences matter. The stronger test for a recovery is whether price can remain firm across subsequent sessions and whether net demand broadens, rather than depending on one positive day.
A green watchlist can coexist with a weaker global market
The captured CoinGecko global response put crypto market capitalization at approximately $2.572 trillion, down 2.229% over its reported 24-hour comparison. Reported global trading volume was about $63.59 billion, with Bitcoin accounting for 59.28% of market capitalization.
The CoinGecko global charts provide reader-readable live context. These aggregate figures use CoinGecko’s universe and update timing; they do not share an identical measurement clock with the Binance tickers.
That difference deserves attention. A handful of positive USDT pairs does not prove that the wider market has recovered. Broader weakness can reflect other assets, different reference prices and different update windows. This snapshot cannot isolate how much each factor contributes, so it would be misleading to explain the discrepancy with a confident story about capital rotation.
The practical reading is narrower: major pair prices have bounced, while the captured aggregate remains weaker. Before increasing confidence in a market-wide recovery, look for consistency across measures taken over matching windows. Otherwise, you can accidentally compare a fresh bounce with a slower summary and mistake the timing gap for a trading signal.
Why the identity of the buyer matters
There is a reason ETF flows deserve more attention than a single green candle. In its Q3 Bitcoin demand analysis, published November 2 with data through September 30, 21shares reported that US spot ETFs added 79,800 BTC during the quarter, compared with 41,300 BTC newly mined.
The same report said long-term holders reduced their balances by 248,000 BTC. These are historical cohort and fund measurements, not evidence that whales bought or sold this morning. Long-term holders also are not interchangeable with large-wallet holders: holding age and wallet size answer different questions.
My interpretation is that a recovery becomes more fragile when a previously important source of absorption turns negative. Other buyers can replace it, but this morning’s price ticker does not identify them. Without current, verified wallet-level evidence, claims that whales are rescuing the market would be narrative decoration.
That leaves a useful discipline: distinguish observed price resilience from an explanation for it. The former is visible in the snapshot. The latter needs additional evidence, particularly when leveraged positioning or short covering could also influence price.
The Binance security overhang remains relevant
The FBI’s October 31 alert attributes the theft of more than $6 billion from Binance around October 29 to North Korean TraderTraitor actors. It says stolen assets were being converted primarily into Ether.
That is an official attribution concerning the attack, not a finding about today’s exchange solvency or an estimate of remaining losses. This article has no independently verified live measure of the exchange’s balance sheet or withdrawal backlog.
For the market, the analytical issue is confidence in the venue alongside confidence in the asset. A Bitcoin price bounce cannot by itself demonstrate that custody concerns have disappeared. Conversely, exchange-specific stress does not establish a defect in Bitcoin’s settlement rules. Those risks need separate evidence, even when they appear in the same week’s headlines.
The weekend levels that make this view testable
The immediate observed boundaries are 74,888 and 76,378 USDT. These are rolling-window extremes from the captured ticker. They are provisional reference points, not independently validated, multi-session support and resistance zones.
| Reference | Level, USDT | What would be informative |
|---|---|---|
| Observed range ceiling | 76,378 | A break followed by sustained trading above it |
| Snapshot price | 76,056.10 | Whether bids persist when price revisits the area |
| Round-number reference | 75,000 | Trading behavior around a psychological level |
| Observed range floor | 74,888 | Whether a retest holds or sellers establish lower prices |
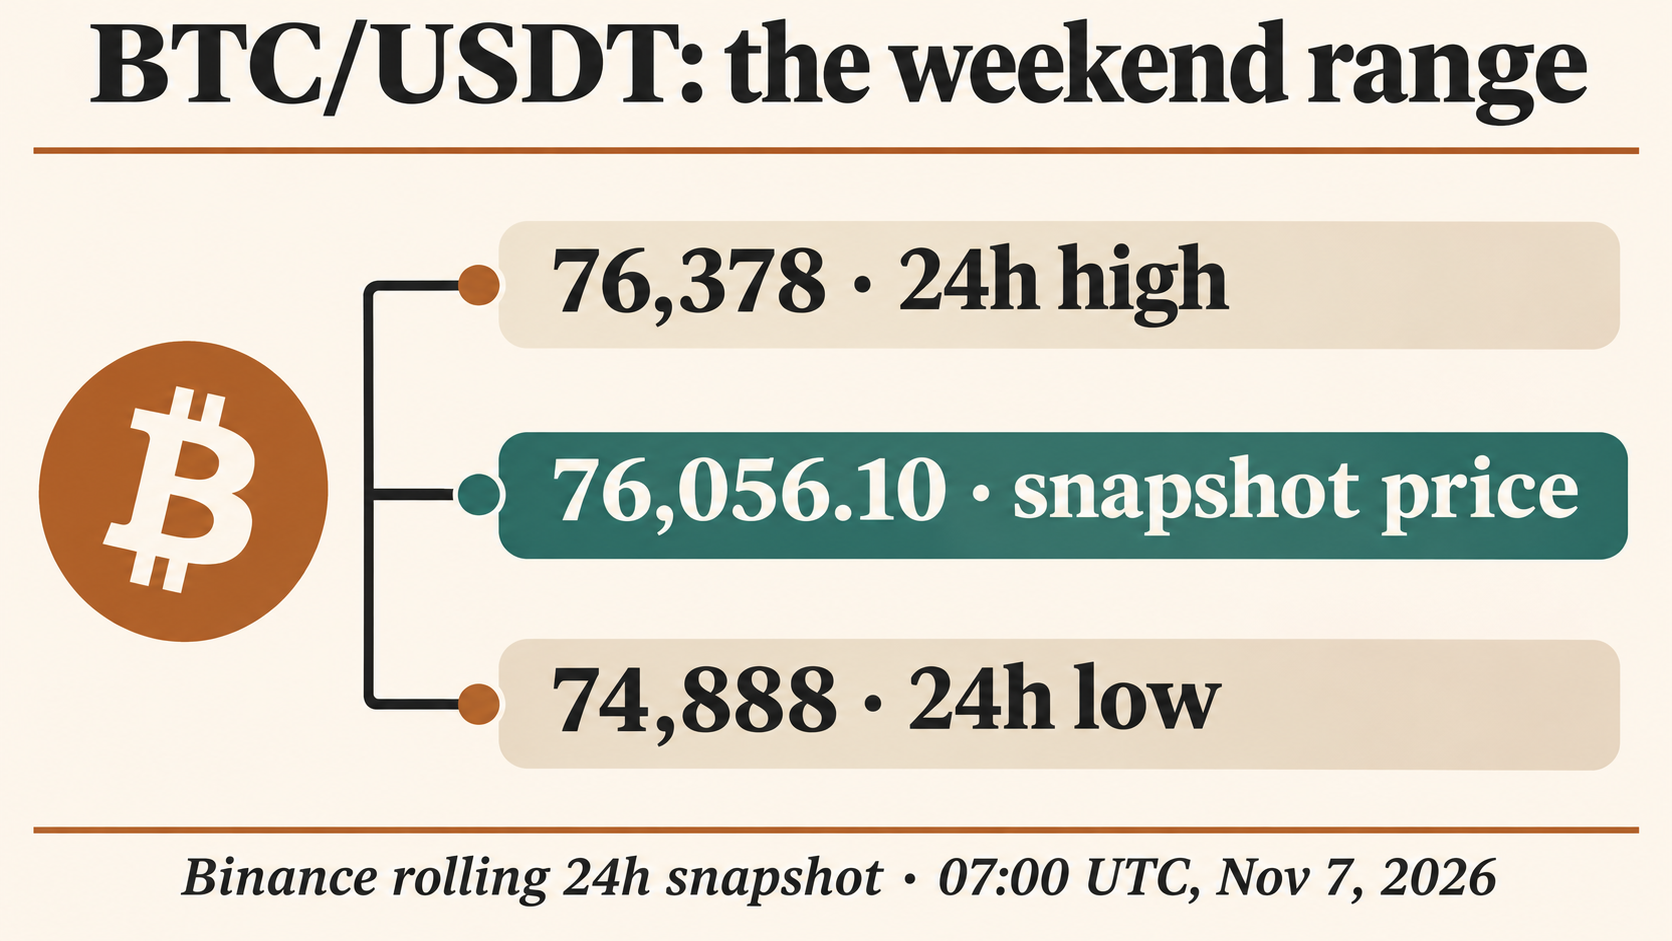
AI-generated level diagram, not a historical price chart or forecast.
A constructive scenario would involve price moving above the ceiling, holding a subsequent retest and attracting continued spot participation. A weaker scenario would involve repeated rejection near the high followed by a loss of the floor. Neither has happened merely because it appears in this table.
The ambiguous scenario is also worth naming: price stays inside the range while traders repeatedly chase small moves. In that environment, execution costs accumulate faster than useful information. A plan can include waiting for a clearer observation rather than assigning every fluctuation a directional meaning.
If you choose to trade, define the exposure first
Decide how much you can lose before selecting a position size. A stop order does not guarantee a fill at the requested price, and leveraged positions can face liquidation before a longer-term thesis has time to work. Exchange custody is an additional decision, particularly following a reported security incident.
For readers who independently choose Binance and are eligible to use it, the signup offer is separate from this market analysis:
Review the RATE20 signup offer on Binance →
The link pre-applies RATE20, advertised here as a 20% trading-fee discount. Verify the referral benefit, eligible products and regional terms displayed during registration. This is a referral link; SmallDrift may earn a commission.
Our guide, Get 20% off with code RATE20, explains the signup process. No fee saving offsets an unsuitable trade or eliminates custody risk.
What would change the assessment next week?
Watch three observations together: whether the captured range breaks and holds, whether subsequent ETF sessions show renewed demand, and whether broader market measures confirm the large-token rebound. A stronger price with improving flows would be more persuasive than either alone.
A rising price alongside continuing redemptions would still be meaningful, because it would suggest other demand absorbing supply. It would not identify that demand without further research. A falling price with continued outflows would instead reinforce the current headwind, while still leaving the size and timing of any further move uncertain.
This is a framework for updating a view. It is deliberately conditional because the weekend tape cannot answer Monday’s fund-flow question in advance.
Frequently asked questions
Why is Bitcoin above $76,000 despite ETF outflows?
ETF flows are one source of demand, while Bitcoin trades continuously across many participants. The snapshot shows resilience after a negative fund-flow week, but it cannot establish who supplied the offsetting bids or whether the rebound will persist.
How much did Bitcoin ETFs lose this week?
Farside’s November 2–6 rows sum to $1.2817 billion in net outflows. This is a five-session total, including Friday’s $411.9 million outflow, and remains subject to source revisions.
What Bitcoin price levels matter on November 7, 2026?
The captured BTC/USDT rolling range runs from 74,888 to 76,378. The 76,056.10 snapshot sits near its upper boundary. These levels describe one exchange pair and window; they are neither guaranteed turning points nor a verified long-term technical setup.
Review Binance registration with code RATE20 →
Referral code RATE20 is pre-applied. Confirm the displayed discount and eligibility before completing registration.
This article is for informational purposes only and does not constitute financial advice. Always do your own research before making investment decisions.
Get 20% Off Binance Trading Fees with RATE20
New to Binance? Open the official signup page with RATE20 already applied for a 20% trading-fee discount. You do not need to copy or type the code. Review the referral details before completing registration.
- Referral code: RATE20, pre-applied by this link
- Fee discount: 20%, shown on the Binance signup screen
- Additional rewards: Check Binance for current promotions and regional availability
Be wary of unofficial referral offers promising benefits they cannot show. The Binance signup screen lets you check the code and fee discount directly.
Compare Binance fees and available discounts →
SmallDrift may earn a commission when you sign up through this link. Trading involves risk, including loss of capital.
Related Articles



Explore Related Guides
Daily Crypto Market News
Follow Bitcoin price moves, major altcoins, and the events shaping the market.
Bitcoin ETF Flows Guide
Understand ETF inflows and outflows, and how to read them alongside price action.
Binance Fee Calculator
Learn how to estimate trading costs with referral and BNB discounts.
Verified Binance Referral Guide
See how RATE20 is applied and what to check on the Binance signup screen.