Bitcoin's $201M ETF Exit Tests the Bounce: November 10, 2026
Bitcoin edges up to 74,700 USDT despite fresh ETF outflows. The rolling range and weak altcoin participation set the next test for buyers.

Bitcoin is edging higher even as US spot Bitcoin ETFs report another $201 million in net withdrawals. At 74,700 USDT on Binance, the bounce is real, but evidence of a durable return in demand is still thin. Today’s test is whether buyers can hold the middle of the observed trading range and eventually clear its upper boundary without another wave of selling.
Research cutoff: November 10, 2026, 07:02:34 UTC. Binance spot API snapshots were retrieved at 07:01:16 UTC, covering rolling 24-hour windows ending around that time on November 10. Prices are USDT quotes for the named pairs, not consolidated US-dollar prices. ETF figures cover the November 9 US session. Linked market pages show current data, which can differ from this historical snapshot. All three images are original AI-generated conceptual illustrations, not trading charts or documentary photographs.
What is Bitcoin’s price on November 10?
BTC/USDT was 74,700, up 0.519% over the sampled rolling 24 hours. The observed low was 73,750 and the high was 75,568.18. That places the quote roughly halfway through the range, rather than at a decisive breakout point.
The official Binance market overview is the reader-facing reference for live markets. Its aggregate figures can differ from the pair-specific snapshots below because timing, caching and methodology differ. The table preserves the actual API responses used here.
| Binance spot pair | Last price, USDT | Rolling 24h change | Rolling low | Rolling high | Quote turnover, USDT |
|---|---|---|---|---|---|
| BTC/USDT | 74,700.00 | +0.519% | 73,750.00 | 75,568.18 | 1.015 billion |
| ETH/USDT | 2,118.95 | +0.362% | 2,083.10 | 2,151.90 | 517.89 million |
| SOL/USDT | 86.21 | +0.233% | 85.14 | 88.07 | 150.92 million |
These are rolling comparisons, not returns since midnight, since the US market close, or since a particular news headline. That distinction is especially useful when two screens appear to disagree about whether Bitcoin is green or red.
The encouraging part is straightforward: all three sampled pairs have positive changes. The limitation is equally straightforward: these are small advances, and two altcoins do not establish market-wide breadth. A bounce can begin this quietly. It can also end this quietly.
Why does the latest ETF withdrawal matter?
The November 9 net outflow means the latest completed US session did not confirm a return of fund demand. Farside Investors’ daily flow table reports $213.2 million leaving IBIT and $9.9 million leaving ARKB, partly offset by $22.1 million entering MSBT. The net total is negative $201.0 million.
| November 9 US session | Net flow, USD millions |
|---|---|
| IBIT | -213.2 |
| ARKB | -9.9 |
| MSBT | +22.1 |
| All tracked funds combined | -201.0 |
The narrower conclusion is the useful one: the tracked ETF channel remained a source of net withdrawals in that session. It does not establish the motives of every holder, and it does not tell us what every institution did elsewhere.
A fund redemption is also a different measurement from exchange trading volume. Turnover counts repeated transactions; net fund flow measures money entering or leaving a particular product channel. Putting the two figures next to each other does not create a market balance sheet.
This matters because a tempting argument is that large exchange activity must have absorbed the withdrawal. Price formation is more complicated. Participants can hedge, transact across venues, or change exposure through derivatives. The available snapshots do not let us trace the other side of each ETF-related transaction.
For the next US session, the informative development would be a shift in the direction and distribution of flows. A positive aggregate concentrated in one product would be a first improvement. Repeated positive sessions across several products would offer stronger evidence that demand is broadening. Neither outcome is guaranteed by a green Bitcoin quote today.

Conceptual illustration: exchange turnover and net ETF flows measure different things.
Which Bitcoin levels matter next?
The observed 73,750–75,568.18 range provides reference points, not a forecast. Its arithmetic midpoint is 74,659.09, just below the snapshot price. These levels come from the captured rolling high and low; they are not a claimed moving average, order-book wall or independently established support system.
| Reference | BTC/USDT level | What a trader can observe |
|---|---|---|
| Rolling low | 73,750.00 | Whether another visit attracts buyers or breaks lower |
| Arithmetic midpoint | 74,659.09 | Whether price can spend time in the upper half |
| Snapshot price | 74,700.00 | The historical quote used in this article |
| Psychological round number | 75,000.00 | Whether repeated trading above it persists |
| Rolling high | 75,568.18 | Whether a range break holds on a retest |
The range spans 1,818.18 USDT. A roughly 41-USDT premium to its midpoint is too small to carry a grand market thesis. Bitcoin is above the middle by a whisker; the whisker does not need its own investment committee.
A constructive sequence would involve sustained trading above the midpoint, a move through the high, and buyers defending a subsequent pullback. That sequence would strengthen the case that the market is accepting higher prices. A single wick above the high would provide weaker evidence because it could reflect a brief liquidity sweep.
A defensive sequence would look different: repeated failure in the upper half, a loss of the midpoint, and renewed pressure on the low. Breaking the low would invalidate the idea that this particular rolling range is containing the decline. It would not, by itself, identify the next reliable floor.
These are conditional observations. The API response is a summary of a completed rolling window, not a full candle history or a live order book. It cannot justify a precise multi-week target or a promise about where stops will execute.
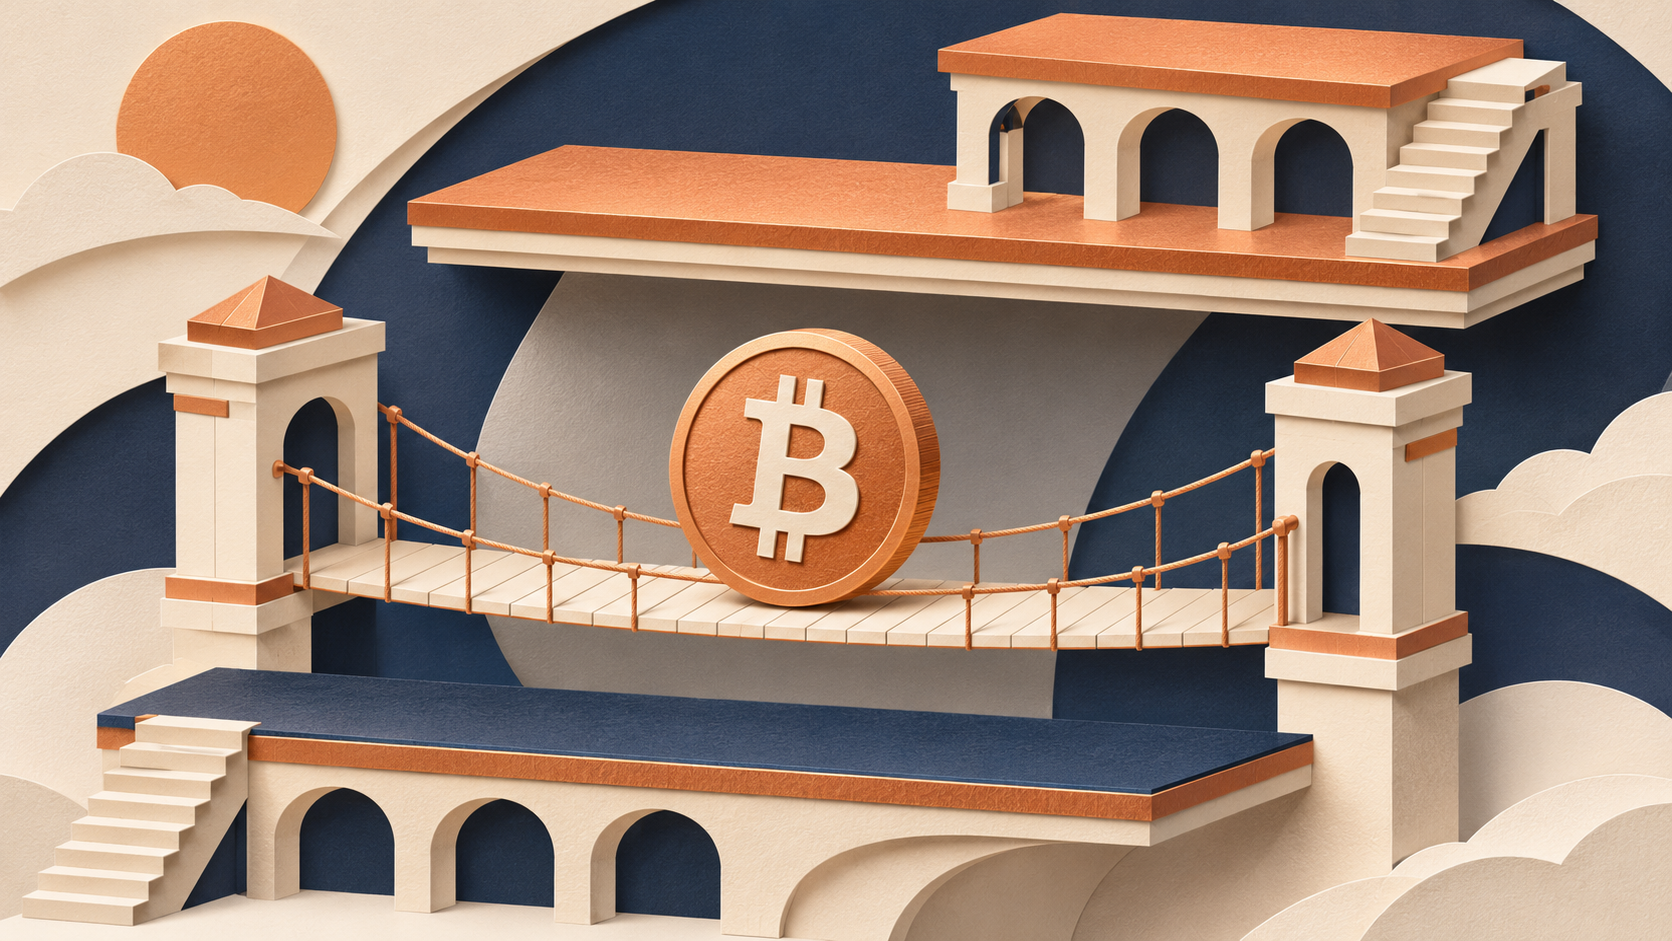
Conceptual illustration of range boundaries; the table contains the measured levels.
Does the altcoin bounce confirm strength?
The sampled altcoins are participating, but they are not leading Bitcoin in the captured window. That leaves an open question about whether risk appetite is extending beyond the largest asset.
For a stronger breadth argument, watch whether several liquid assets can maintain higher lows while Bitcoin consolidates. If Bitcoin stalls and those assets immediately surrender their gains, the apparent recovery may be mostly a response to Bitcoin’s direction. If they hold while Bitcoin pauses, the evidence becomes more interesting.
A trader should also distinguish percentage performance from executable liquidity. A token can post a spectacular percentage move in a shallow market while offering poor execution for an ordinary order. Conversely, a small move in a liquid pair can be easier to enter and exit predictably. Neither the size of a green number nor the popularity of a ticker answers the execution question.
CoinGecko’s global market charts provide a broader market reference. The retrieved global API snapshot put total capitalization near $2.508 trillion, down about 1.42% over 24 hours, with Bitcoin dominance near 59.58%. That aggregate and the positive pair returns are different datasets and windows; they should not be forced into a single synchronized story.
The discrepancy is a reason to retain timestamps and definitions. It is not evidence that one small group of positive pairs has repaired the wider market. Likewise, no independently verified current whale accumulation series was obtained for this report, so a claim that large holders are secretly buying would go beyond the evidence.
Binance recovery remains an execution question
Binance’s November 6 recovery update described progressive withdrawal reopening across additional asset-network pairs, subject to readiness checks. It instructed users to confirm availability for their chosen asset and network. That is an operational update, not a blanket statement that every withdrawal route is available today.
The practical implication is to check the exact route before moving funds. A token name alone does not identify the network, and a trading screen does not establish that an external transfer will complete immediately. Treat execution, custody and price exposure as separate decisions.
If you independently decide Binance is suitable and available in your jurisdiction, review the referral details shown during registration. This site may earn a commission from qualifying referrals.
Register on Binance with referral code RATE20 →
The signup link pre-applies RATE20. Check any displayed discount, product eligibility and regional terms before completing registration. Our guide explains the process: Get 20% off with code RATE20.
A usable checklist for the next session
The task is to gather confirmation in the right order. Start with what price is doing, then ask whether participation and fund demand support it. Reversing that order often turns a preferred narrative into a trading instruction.
- Price acceptance: Does Bitcoin stay in the upper half of the captured range, or repeatedly slip back below it?
- Range behavior: Does a break above the high survive a pullback, or quickly reverse?
- Participation: Do liquid altcoins retain gains when Bitcoin pauses?
- Fund demand: Does the next completed ETF session show an improvement, and how widely is it distributed?
- Execution: Are spreads, order depth and the intended withdrawal route acceptable at the time of action?
Decide what would invalidate a trade before entering it. Position size should reflect that invalidation distance and the possibility of slippage. A stop order is an instruction to execute under specified conditions; it is not insurance against a gap or a disorderly market.
Fees deserve similar discipline. Frequent entries and exits can consume the expected benefit of a narrow range trade even when the directional call is reasonable. Compare the actual fee displayed for your product, account and order type, and include spread and possible slippage. A limit order that crosses the book can still execute as a taker; merely choosing a limit price does not guarantee a maker fee.
Review Binance registration with RATE20 →
Verify the offered terms before relying on any saving. A discount changes transaction cost, not the probability that the market follows your thesis.
Frequently asked questions
Why is Bitcoin rising while ETFs have outflows?
Spot prices and daily ETF flows measure different activity over different windows. Other buyers can support price while one product channel experiences withdrawals. The snapshots do not identify every buyer or prove that the outflow caused the next move.
What are Bitcoin’s key levels on November 10, 2026?
The captured BTC/USDT rolling low was 73,750 and the high was 75,568.18. Their midpoint was 74,659.09. These are timestamped reference levels; they can change as the rolling window advances and should not be treated as guaranteed support or resistance.
Has the Bitcoin recovery been confirmed?
The available evidence supports a modest bounce, with confirmation still incomplete. Stronger price acceptance, wider participation and improved completed ETF flows would make the recovery argument more persuasive. Until then, a small positive return should carry a small claim.
This article is for informational purposes only and does not constitute financial advice. Always do your own research before making investment decisions.
Get 20% Off Binance Trading Fees with RATE20
New to Binance? Open the official signup page with RATE20 already applied for a 20% trading-fee discount. You do not need to copy or type the code. Review the referral details before completing registration.
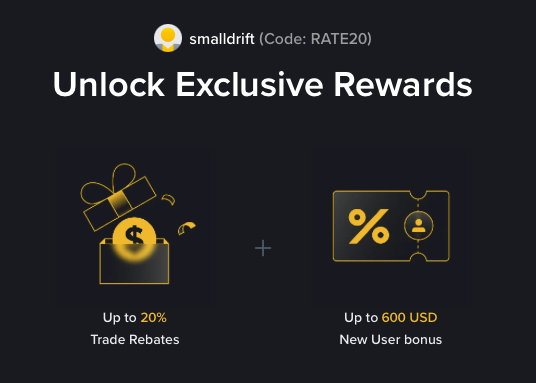
- Referral code: RATE20, pre-applied by this link
- Fee discount: 20%, shown on the Binance signup screen
- Additional rewards: Check Binance for current promotions and regional availability
Be wary of unofficial referral offers promising benefits they cannot show. The Binance signup screen lets you check the code and fee discount directly.
Compare Binance fees and available discounts →
SmallDrift may earn a commission when you sign up through this link. Trading involves risk, including loss of capital.
Related Articles

Explore Related Guides
Daily Crypto Market News
Follow Bitcoin price moves, major altcoins, and the events shaping the market.
Bitcoin ETF Flows Guide
Understand ETF inflows and outflows, and how to read them alongside price action.
Binance Fee Calculator
Learn how to estimate trading costs with referral and BNB discounts.
Verified Binance Referral Guide
See how RATE20 is applied and what to check on the Binance signup screen.