Bitcoin Fell $2,392 Despite ETF Buying—Sep. 24, 2026
Bitcoin falls to $84K despite ETF buying. Review the key price levels, weakening altcoins, and risks to the rebound.

Bitcoin lost $2,392 in 24 hours even though U.S. spot ETFs recorded a fifth straight day of net buying. BTC fell from $86,462 to roughly $84,070, while Wednesday’s ETF session added another $32.4 million and pushed the five-session inflow total to about $2.34 billion. That disconnect matters now: institutional demand is still present, but it is no longer strong enough to let late buyers ignore the wall of supply above $87,000.
What is Bitcoin doing on September 24, 2026?
Bitcoin is trading near $84,070, down 2.77% over 24 hours after sellers rejected the market above $87,000. The live Binance BTC/USDT data showed a rolling low of $83,500, a high of $86,462, and $1.75 billion in quote turnover at the 07:00 UTC research cutoff.
The pullback has erased Wednesday’s follow-through but not Monday’s breakout. Bitcoin remains more than 12% above the September 15 low near $75,000. The problem is shorter-term: a rally powered partly by forced short covering reached a crowded resistance zone, then discovered that real sellers still live there.
| September 24 market snapshot | Price | 24-hour change | Rolling low | Binance quote turnover |
|---|---|---|---|---|
| Bitcoin (BTC) | $84,070.01 | -2.77% | $83,500.01 | $1.75B |
| Ether (ETH) | $2,685.00 | -2.50% | $2,635.39 | $799.8M |
| BNB | $772.02 | -2.50% | $756.83 | $149.0M |
| Solana (SOL) | $114.81 | -3.41% | $113.00 | $391.9M |
| XRP | $1.5011 | -7.66% | $1.4791 | $401.4M |
This is not a Bitcoin-only wobble. XRP surrendered most of Wednesday’s surge, SOL underperformed BTC, and the total crypto market capitalization fell 5.32% to about $2.87 trillion, according to CoinGecko’s global market feed. Bitcoin dominance rose to 58.66%, which is what usually happens when traders reduce risk: they sell the faster horses first.
XRP’s 7.66% fall is the useful warning. A one-day altcoin breakout without durable Bitcoin support can be less “rotation” and more “exit liquidity wearing a party hat.”
Why did Bitcoin fall despite five days of ETF inflows?
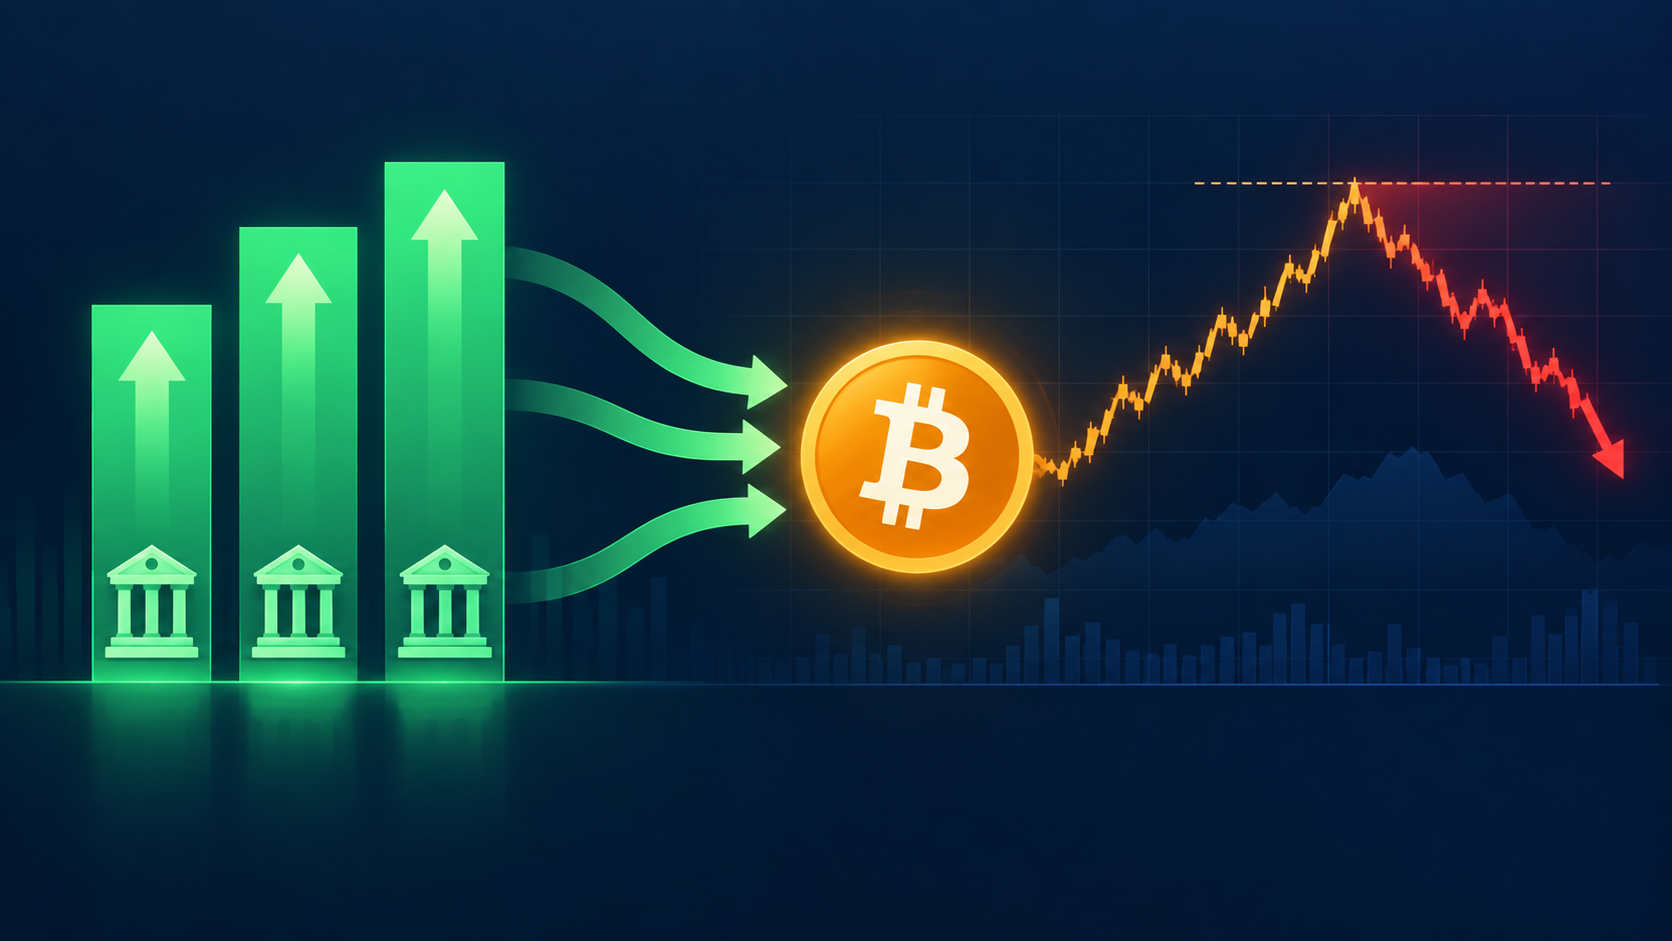
ETF demand is bullish, but daily flow is not an immediate price command. Funds bought approximately $2.34 billion across the five sessions through September 23, yet the pace collapsed from $999.0 million on Monday and $714.7 million on Tuesday to just $32.4 million on Wednesday, based on the Farside Investors flow table.
| U.S. spot Bitcoin ETF session | Net flow |
|---|---|
| September 17 | +$159.5M |
| September 18 | +$433.0M |
| September 21 | +$999.0M |
| September 22 | +$714.7M |
| September 23 | +$32.4M |
| Five-session total | +$2.34B |
Three forces explain the apparent contradiction.
- The marginal bid weakened. A positive $32.4 million session is still buying, but it is only 3.2% of Monday’s inflow. Price responds to the change at the margin, not the applause attached to a five-day streak.
- ETF settlement and continuous crypto trading run on different clocks. Bitcoin trades around the clock; U.S. funds do not. Overnight deleveraging can overpower the prior session’s cash creation before ETF desks reopen.
- The $87,000-$90,300 area contains real supply. Traders who bought earlier in the cycle can sell near break-even, while short-term buyers naturally take profit after a roughly $12,000 rebound.
So the ETFs are not “failing.” They helped absorb supply and lifted Bitcoin out of the mid-$70,000s. But an inflow streak cannot repeal market structure. Monday’s billion-dollar day opened the door; it did not remove the sellers waiting behind it.
Is the $84,000 Bitcoin breakout already broken?
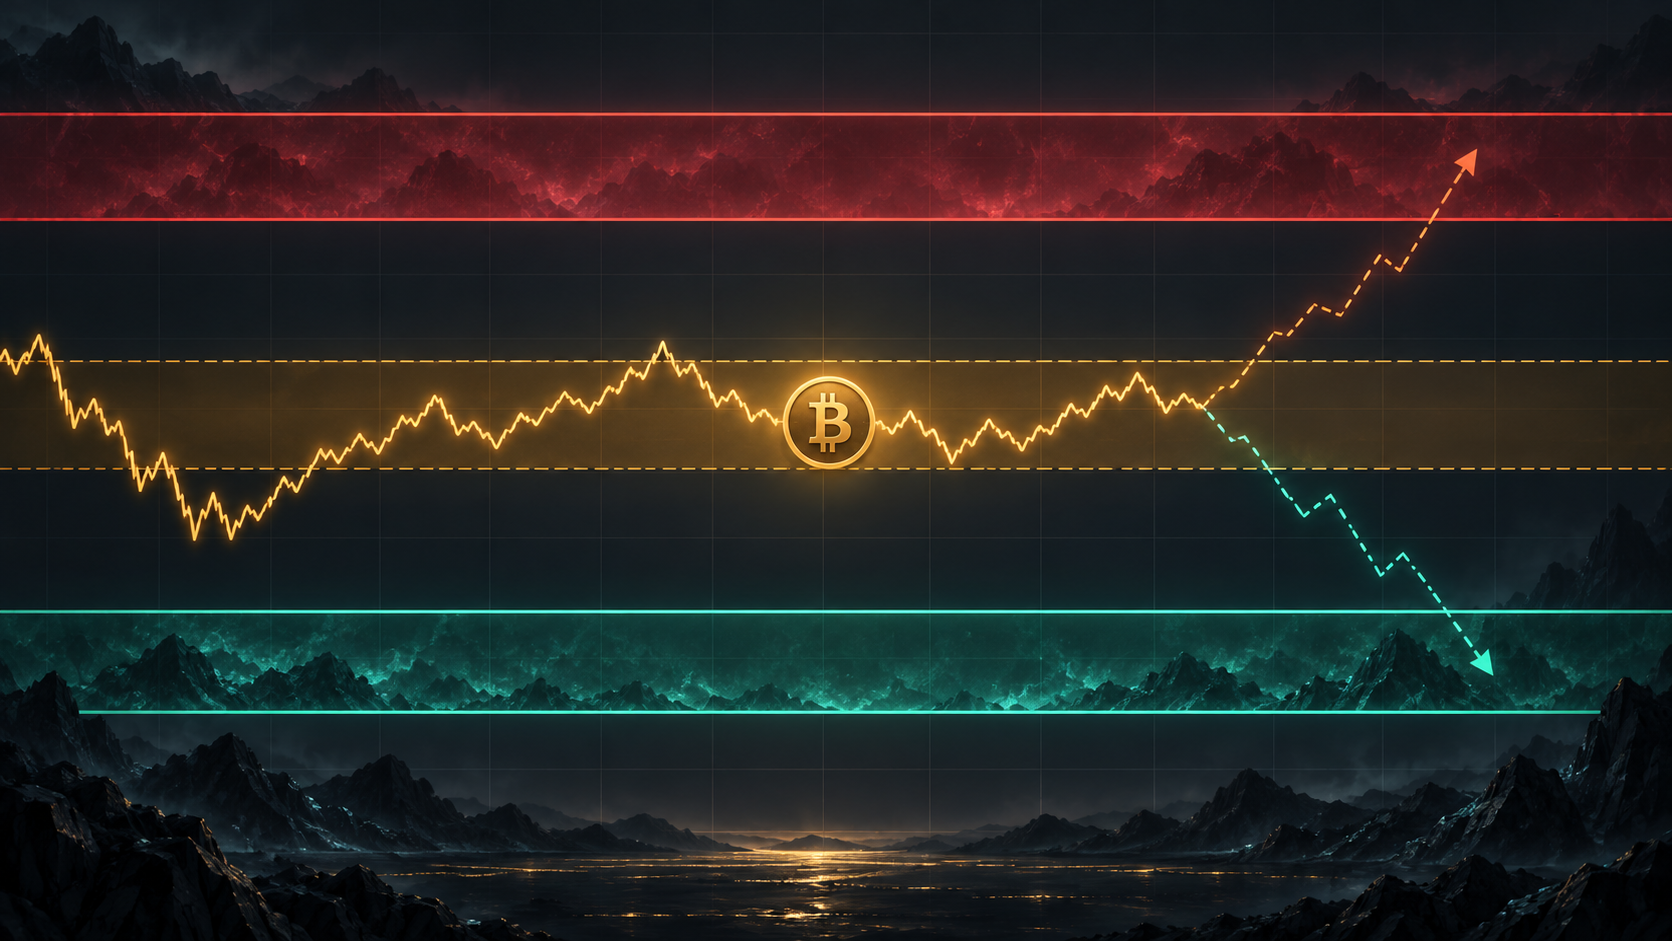
No—not yet—but $83,500 is now the first line that bulls must defend. The latest intraday low marks immediate support, while the larger structure remains intact above roughly $80,000-$82,000. A daily close back above $85,000 would suggest the selloff was a leverage reset. Repeated closes below $82,000 would turn the rejection into a failed breakout.
The September 24 technical analysis from UseTheBitcoin identifies a rising trendline from the $75,000 low and a deeper support zone around $80,000-$82,000. It also places holder cost bases near $88,000 and $90,000, helping explain why the rally met resistance before $90,300.
| Bitcoin level | Role | What confirms it |
|---|---|---|
| $83,500-$84,000 | Immediate support | Buyers reclaim $85,000 after testing the zone |
| $80,000-$82,000 | Breakout support | Daily closes hold and selling volume contracts |
| $75,000-$78,000 | Failure zone | Exposed if $80,000 breaks decisively |
| $86,500-$87,400 | First resistance | Price closes above the recent high, not merely wicks through it |
| $88,000-$90,300 | Holder supply | Sustained breakout plus follow-through on rising spot volume |
The practical distinction is simple. Above $82,000, the market is retesting a breakout. Below $80,000, it is repairing a failed one. Between those levels, confident predictions are mostly expensive ways to say “I have a chart.”
Trade the confirmation, not the headline
The ETF streak improves the medium-term backdrop, but today’s tape rewards patience. A reclaim of $85,000 with BTC holding above $83,500 offers a cleaner bullish confirmation; a break below $82,000 argues for smaller size and tighter risk.
Sign up on Binance with 20% fee discount →
Use referral code RATE20 for a permanent 20% off all trading fees.
What does the altcoin selloff say about risk?
Altcoins are signaling de-risking, not a healthy broad-market pause. BTC fell 2.77%, but SOL lost 3.41% and XRP dropped 7.66%. When higher-beta assets fall much faster than Bitcoin while BTC dominance rises, the market is usually cutting exposure rather than rotating capital into a new leader.
That does not make every altcoin bearish. Ether still has a defensible support cluster around $2,626-$2,672 and a stronger zone near $2,544-$2,560. SOL’s $113 intraday low is the immediate reference point. But both need Bitcoin to stabilize; neither is currently strong enough to drag BTC through resistance.
| Asset | Immediate support | First recovery level | Risk signal |
|---|---|---|---|
| BTC | $83,500 | $85,000 | Daily close below $82,000 |
| ETH | $2,626-$2,672 | $2,786-$2,800 | Break below $2,544 |
| SOL | $113 | $119-$120 | Loss of $110 |
| XRP | $1.48-$1.50 | $1.58-$1.63 | Failure to reclaim $1.50 |
For active traders, the better question is not which coin fell most. It is which one recovers first after Bitcoin stops falling. Relative strength after the shock carries more information than relative strength before it.
Binance added pairs—but liquidity still outranks novelty
Binance recently added ARB/U and ENA/USD1 spot pairs plus trading-bot support, according to its September 22 announcement. New pairs can create bursts of attention, but today’s broad pullback is a reminder that listing news does not override market beta.
If you trade a newly added pair, check order-book depth, spreads, and regional availability before sizing the position. The exciting ticker is rarely the same thing as the liquid ticker.
How can traders reduce fees while volatility stays high?
Stack the available discounts instead of letting frequent entries compound your costs. Binance users can combine the signup referral, BNB fee payment, and limit orders where appropriate.
- 20% off — Use referral code RATE20 at signup
- 25% off — Pay fees with BNB token
- Maker discount — Use limit orders for even lower futures fees
Effective fee: as low as ~0.06% per trade.
| Example spot volume | Standard 0.10% fee | Approx. 0.06% stacked fee | Approx. savings |
|---|---|---|---|
| $10,000 | $10 | $6 | $4 |
| $50,000 | $50 | $30 | $20 |
| $100,000 | $100 | $60 | $40 |
Start trading on Binance with maximum discount →
For the complete signup and verification walkthrough, get 20% off with code RATE20.
What should traders watch next?
Watch price acceptance, not another intraday wick. The next useful signal is whether Bitcoin can regain $85,000 and remain there through a daily close. That would show buyers absorbing the post-rally supply. A brief spike to $86,000 followed by another retreat would merely repeat this week’s problem.
The checklist is short:
- Bullish: BTC holds $83,500, reclaims $85,000, and challenges $87,400 on firm spot volume.
- Neutral: BTC ranges between $82,000 and $85,000 while ETF flows stay positive.
- Bearish: BTC closes below $82,000 and altcoin losses accelerate.
- Structural failure: BTC loses $80,000, exposing $75,000-$78,000.
The contrarian takeaway is that today’s red candle does not disprove ETF demand. It proves demand has a price. Institutions bought aggressively near $80,000; above $87,000, existing holders finally offered them enough inventory.
Bitcoin and Binance referral FAQ
Why is Bitcoin falling despite ETF inflows?
Bitcoin is falling because ETF demand slowed sharply while price reached heavy supply between $87,000 and $90,300. The funds still recorded net buying, but Wednesday’s $32.4 million was far smaller than Monday’s $999.0 million, leaving room for profit-taking and leveraged long liquidations to control the short-term move.
What is the most important Bitcoin support today?
The immediate support is $83,500-$84,000, while $80,000-$82,000 is the more important breakout-defense zone. Holding the first can produce a quick recovery; losing the second would materially weaken the rebound from $75,000.
What is the best Binance referral code?
The best Binance referral code is RATE20. It provides a permanent 20% trading-fee discount for eligible new accounts; availability and product access vary by jurisdiction.
Create your Binance account with 20% fee discount →
Referral code: RATE20 — permanent 20% off all trading fees.
This article is for informational purposes only and does not constitute financial advice. Always do your own research before making investment decisions.
Market-data note: Prices, volumes, and percentage changes are snapshots from the research time stated in this article, not live quotes. Linked market pages show current data and may differ from these historical figures.
Get 20% Off Binance Trading Fees with RATE20
New to Binance? Open the official signup page with RATE20 already applied for a 20% trading-fee discount. You do not need to copy or type the code. Review the referral details before completing registration.

- Referral code: RATE20, pre-applied by this link
- Fee discount: 20%, shown on the Binance signup screen
- Additional rewards: Check Binance for current promotions and regional availability
Be wary of unofficial referral offers promising benefits they cannot show. The Binance signup screen lets you check the code and fee discount directly.
Compare Binance fees and available discounts →
SmallDrift may earn a commission when you sign up through this link. Trading involves risk, including loss of capital.
Related Articles


Explore Related Guides
Daily Crypto Market News
Follow Bitcoin price moves, major altcoins, and the events shaping the market.
Bitcoin ETF Flows Guide
Understand ETF inflows and outflows, and how to read them alongside price action.
Binance Fee Calculator
Learn how to estimate trading costs with referral and BNB discounts.
Verified Binance Referral Guide
See how RATE20 is applied and what to check on the Binance signup screen.