Bitcoin Near $83K: Can It Hold? — October 19, 2026
Bitcoin rebounds to $82,897 after a $228.4M week of ETF outflows. Daily range levels and uneven market breadth frame Monday's confirmation test.

Bitcoin is just 20.11 USDT below its rolling 24-hour high, but the institutional buying test has barely begun. BTC/USDT traded at 82,897.51 early Monday, up 1.412%, after U.S. spot Bitcoin ETFs finished last week with net withdrawals. If you are treating a green screen as proof that demand has returned, today’s distinction matters: a rebound can arrive before its confirmation.
Research cutoff: October 19, 2026, 07:01:59 UTC. Spot snapshots were retrieved around 07:00:58 UTC; Binance’s response clocks put their rolling-window endpoints around 07:01:00 UTC. Figures below are captured observations, not closing prices. Linked market pages show current data, which can differ from this article’s snapshot. Prices are in USDT for the named Binance spot pairs; ETF flows are U.S. dollars for completed U.S. trading sessions.
What does Bitcoin near $83,000 actually tell us?
It shows buyers have recovered most of the latest daily range; it does not establish a sustained breakout. The BTC/USDT rolling high was 82,917.62 and the low was 80,684.36. At the snapshot, price sat about 99.1% of the way from that low to the high.
That is a useful observation because it describes where buying has taken the market. It says nothing by itself about how long buyers will stay. A last trade near the high is a location, not a forecast.
The official Binance market overview provides the reader-facing reference for these spot markets. Its live quotes will move after publication. The underlying research preserves the separate pair responses and their timestamps rather than attempting to reconstruct a single exchange-wide closing print.
| Binance spot pair | Last price, USDT | Rolling 24h change | Rolling low–high, USDT | Quote turnover, USDT |
|---|---|---|---|---|
| BTC/USDT | 82,897.51 | +1.412% | 80,684.36–82,917.62 | 976.26 million |
| ETH/USDT | 2,432.40 | +0.806% | 2,329.00–2,438.40 | 436.61 million |
| SOL/USDT | 105.82 | +1.976% | 100.43–105.99 | 168.92 million |
| BNB/USDT | 728.21 | +1.022% | 705.86–729.38 | 62.05 million |
The pair windows run approximately from October 18 at 07:01 UTC to October 19 at 07:01 UTC, with subsecond differences preserved in the research record. Turnover means quote-asset trading volume on those Binance pairs over those windows. It is neither worldwide volume nor money flowing into crypto.
Bitcoin’s last trade was also above its 81,846.36 USDT volume-weighted average for the same rolling window. That places the latest buyer above the average traded price in this sample. It does not show whether volume is unusually strong: we have not collected a comparable series of earlier windows for that judgment.

AI-generated editorial illustration; not a chart or a depiction of measured fund flows.
What are the nearest Bitcoin levels to watch?
The immediate test is 82,917.62–83,000 USDT, followed by whether the market can retain its recovered ground. The first number is observed; the second is a round-number reference. Calling both “resistance” without explaining that difference would give a psychological level the authority of an actual traded high.
Here is a practical map built from the captured BTC/USDT response. These are reference points for observing subsequent trading, not a claim that resting orders or guaranteed support exist at each price.
| BTC/USDT reference | Why it matters | What would strengthen the rebound |
|---|---|---|
| 82,917.62 | Captured rolling 24h high | Trading above it followed by a successful retest |
| 83,000 | Nearby round number | Sustained acceptance rather than a brief wick |
| 81,846.36 | Rolling volume-weighted average | Pullbacks finding buyers around the prior traded average |
| 81,743.66 | Rolling-window opening price | Avoiding a full reversal of the measured daily gain |
| 80,684.36 | Captured rolling 24h low | Remaining above it through subsequent selling pressure |
A breakout attempt can fail even when price briefly clears every headline number. Watch what follows: whether a pullback is shallow, whether buyers return after the initial burst, and whether the move survives a change in trading session.
Conversely, a return beneath the rolling average would weaken the immediate picture without automatically predicting a collapse. Losing the opening reference would erase the gain relative to this specific window. Breaking the low would be a more direct sign that the recovery structure has deteriorated.
None of these observations requires an invented RSI, an unverified liquidation cluster, or a confident story about what one wallet owner intends. The market supplies enough ambiguity for free.
Has ETF demand returned?
Monday’s ETF demand is unknown at this cutoff. The latest completed row on Farside Investors’ Bitcoin ETF table is Friday, October 16: a net outflow of $82.4 million, including $71.8 million from IBIT and $10.6 million from FBTC.
Adding the five published daily totals for October 12–16 gives $228.4 million of net weekly outflows. Three sessions were negative and two positive. Wednesday’s $261.4 million withdrawal was the largest negative day in that week; Tuesday’s $175.7 million inflow partly offset it.
Those are completed-session figures. There is no Monday total to read into the early spot rebound, and an absent row is not a zero. Later reporting can also revise earlier observations.
The implication is conditional: renewed fund buying would give the rebound another source of demand; continued withdrawals would leave spot buyers absorbing that pressure. Neither outcome is established yet. A price increase before U.S. trading begins cannot settle the question in advance.
For a reader checking the market later, separate the timestamps on price and flows. A current Bitcoin quote beside Friday’s ETF number is a comparison between different observation periods, even when both appear on the same screen.
Put execution behind a clear plan
If you choose to trade this setup, define the failed-rebound scenario before placing an order. Around a daily high, paying more for immediate execution can matter as much as choosing the right directional headline.
Create a Binance account with referral code RATE20 →
The link pre-applies RATE20. Review the referral benefit displayed during registration, your account’s fee schedule, and local eligibility before proceeding. For the signup details, see Get 20% off with code RATE20; the registration screen determines the terms available to you.
Are altcoins confirming Bitcoin’s rebound?
The sampled pairs are positive, but their leadership is uneven. SOL/USDT gained 1.976%, ahead of Bitcoin’s 1.412%. BNB’s 1.022% and Ether’s 0.806% lagged Bitcoin in the captured rolling windows. That is a small cross-section, not an altcoin-season verdict.
The useful question is whether participation broadens as Bitcoin tests its high. If Bitcoin advances while other major assets struggle to keep pace, the move may remain concentrated. If multiple assets retain gains through pullbacks, the evidence for wider risk appetite improves.
Be careful with the word “confirm.” Four green pairs do not represent every token, every exchange, or every investor. They are a manageable watchlist with an explicit scope.

AI-generated editorial illustration of uneven market participation; relative positions are conceptual.
The global picture also resists a simple green-or-red label. The captured CoinGecko global response showed total crypto capitalization of about $2.774 trillion, down 2.390% over its reported 24-hour comparison, with about $64.13 billion in reported volume and Bitcoin dominance of 60.18%. Its internal update time was 06:59:48 UTC.
The CoinGecko global charts cover a broader universe than the four Binance pairs. Aggregate capitalization and individual exchange pair returns use different coverage and update processes. Their divergence deserves attention; it does not establish a data error or prove that today’s bounce is already market-wide.
A global capitalization decline is also not an equivalent dollar withdrawal. Capitalization changes when quoted prices change across circulating supply. Treating the change as literal cash leaving the system would confuse valuation with flows.
What do whale reports add to the picture?
Earlier accumulation reports provide context, not a fresh October 19 buy signal. In its October 15 report, BeInCrypto described CryptoQuant whale holdings of 3.03 million BTC, alongside a more cautious Glassnode assessment of fresh demand and overhead supply.
That report predates today’s snapshot. We have not retrieved a new underlying whale series establishing whether those holdings increased, fell, or stayed unchanged through this morning. It would be misleading to promote the older observation into a claim that whales are buying today.
The same article discussed the $80,000 area below price and $88,000 above it. Those are dated analytical references, distinct from the directly observed daily range used here. They should not be presented as today’s verified order-book walls.
Binance news: separate operations from market demand
The official Binance newsroom lists October 19 updates concerning Dell cash-dividend support and Binance Square’s Write to Earn program. These are platform and product developments. Neither demonstrates new demand for Bitcoin.
This distinction matters when an exchange news feed is busy. A new operational notice may affect a particular product or user action while contributing little to the explanation of BTC/USDT’s daily move. Before assigning a headline causal power, ask which asset, activity, and trading window it actually affects.
For this article, the exchange’s direct contribution to the market assessment is its captured spot data. The broader demand question remains open until more trading and fund reporting arrive.
A checklist for the next session
A useful plan needs observations that can disprove it. For the bullish interpretation, a temporary push above 83,000 is insufficient if the market immediately loses the recovered range. For the cautious interpretation, persistent buying above the old high would be evidence to reconsider.
Watch these developments in sequence:
- Whether BTC/USDT can clear the captured high and retain that ground on a pullback.
- Whether the rolling average and opening-price area attract buyers if momentum fades.
- Whether Ether and BNB improve relative participation while Solana retains its lead.
- Whether the next completed ETF reporting supplies demand confirmation or further withdrawals.
Position size should reflect the distance to a meaningful failure point, along with execution costs. A tight stop can limit a planned loss but can also be triggered by ordinary volatility; it does not guarantee the execution price during a fast move. A limit order controls the acceptable price but may never fill.
The strongest part of today’s setup is Bitcoin’s location near its daily high. Its weakest part is the temptation to treat that location as a complete explanation. Let subsequent trading answer the unresolved questions.
Frequently asked questions
Why is Bitcoin near $83,000 on October 19, 2026?
The captured Binance BTC/USDT price recovered 1.412% over its rolling 24-hour window to 82,897.51. That documents the move, but the available evidence does not isolate a single cause. Monday’s U.S. ETF flow was unavailable at the cutoff.
What Bitcoin support and resistance levels matter today?
The captured high of 82,917.62 and the 83,000 round number are immediate upside references. Below them, the rolling average at 81,846.36, opening price at 81,743.66, and low at 80,684.36 help assess whether the rebound is retaining ground. They are observations, not guaranteed support.
Do positive altcoin prices prove the whole crypto market is recovering?
No. The four Binance pairs sampled here were positive, while CoinGecko’s broader aggregate capitalization comparison was negative. Coverage, timing, and uneven participation matter. Check both the individual assets and the wider market before declaring a broad recovery.
Register on Binance with RATE20 →
Referral code RATE20 is pre-applied. Confirm the displayed benefit and applicable terms before completing registration. This article contains referral links.
This article is for informational purposes only and does not constitute financial advice. Always do your own research before making investment decisions.
Get 20% Off Binance Trading Fees with RATE20
New to Binance? Open the official signup page with RATE20 already applied for a 20% trading-fee discount. You do not need to copy or type the code. Review the referral details before completing registration.
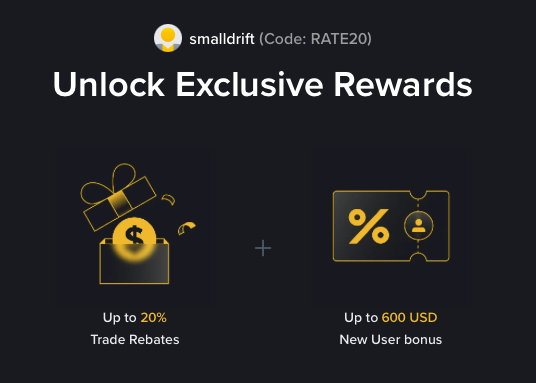
- Referral code: RATE20, pre-applied by this link
- Fee discount: 20%, shown on the Binance signup screen
- Additional rewards: Check Binance for current promotions and regional availability
Be wary of unofficial referral offers promising benefits they cannot show. The Binance signup screen lets you check the code and fee discount directly.
Compare Binance fees and available discounts →
SmallDrift may earn a commission when you sign up through this link. Trading involves risk, including loss of capital.
Related Articles



Explore Related Guides
Daily Crypto Market News
Follow Bitcoin price moves, major altcoins, and the events shaping the market.
Bitcoin ETF Flows Guide
Understand ETF inflows and outflows, and how to read them alongside price action.
Binance Fee Calculator
Learn how to estimate trading costs with referral and BNB discounts.
Verified Binance Referral Guide
See how RATE20 is applied and what to check on the Binance signup screen.