Bitcoin Lost $3.6K Below $80K. What the ETF Bid Missed
Bitcoin trades near $77.6K after failing at $80K. September 2 data show ETF demand, macro pressure, and the levels that matter next.

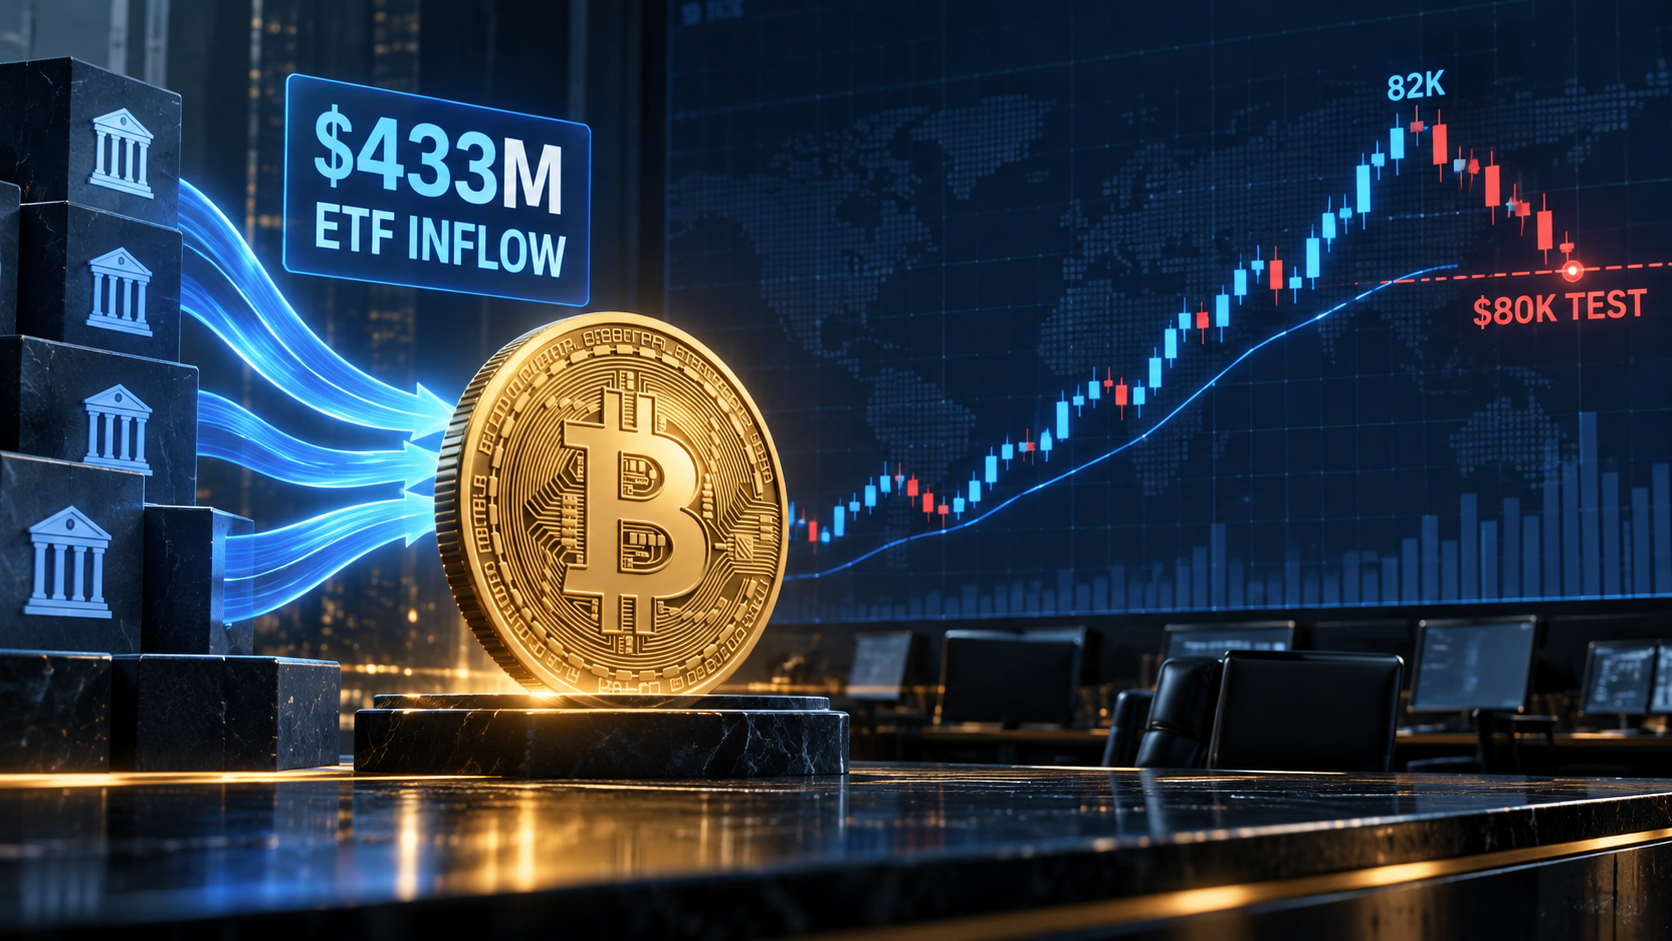
Bitcoin gave back $3,580 from its September 1 high in less than a day, sliding from $78,806 to a $76,420 low on Binance. The complication: U.S. spot Bitcoin ETFs had just absorbed $217 million on Monday after a nine-session run was interrupted. That leaves traders with the only question that matters now: was the $80,000 rejection a failed breakout—or simply the bill for an August move that got ahead of itself?
The tape says both camps have evidence. BTC last traded at $77,642.75, down 1.38% over 24 hours, with $1.07 billion in BTC/USDT turnover on Binance. The broader crypto market capitalization fell 4.37% to roughly $2.63 trillion, while Bitcoin’s share rose to 59.10%, according to CoinGecko’s global market data. That is not a classic altcoin-risk-on backdrop. It is capital moving toward the largest lifeboat while the water gets choppy.
Is Bitcoin’s $80K rejection bearish?
Not by itself: the rejection is a warning, not a verdict. Bitcoin rallied roughly 24% through August, pushed briefly above $81,000, and is now digesting that vertical move near $77.6K. A round-number rejection after a fast rally is ordinary price discovery; the signal becomes bearish only if price loses the prior breakout area while demand also disappears.
The immediate market context is less friendly than it was a week ago. CoinDesk reported that Bitcoin ETFs took in $217 million on September 1, while oil strength and rising odds of a September Fed hike pressured risk assets. In other words, the institutional bid showed up, but macro did not send a thank-you note.
| Snapshot, September 2 | Latest reading | Why it matters |
|---|---|---|
| BTC/USDT last price | $77,642.75 | Below the $80K psychological ceiling |
| BTC 24-hour range | $76,420–$78,806 | Defines the first near-term decision zone |
| BTC/USDT quote volume | $1.07B | Liquid enough for the move to be meaningful |
| Total crypto market cap | $2.63T | Down 4.37% over 24 hours |
| BTC market-cap share | 59.10% | Capital is concentrating rather than rotating broadly |
All trading figures above are from the live Binance 24-hour ticker, captured September 2, and are snapshots rather than closing prices.
The contrarian read is that the market is obsessing over a nice, round headline number. $80,000 is visually neat, which is exactly why it attracts orders, commentary, and a small army of people who suddenly discovered horizontal lines. The more useful question is whether sellers can force BTC below the low-$76,000s and keep it there—or whether that liquidity is absorbed.
ETF demand is supportive—but it is not a force field
The ETF bid matters because it turns a purely speculative move into a measurable demand story; it does not cancel macro risk. Farside’s daily Bitcoin ETF flow table remains the cleanest public scoreboard for U.S. spot-fund flows. CoinDesk’s September 1 reporting puts Monday’s net intake at $217 million after an outflow ended the prior streak.
That distinction matters. ETF flows are reported after the trading session; the spot market trades continuously and reprices interest-rate expectations, oil, equities, derivatives positioning, and headlines in real time. A positive flow day can coexist with a red Bitcoin candle. Markets are capable of holding two thoughts at once, despite their reputation.
The market’s own behavior supports restraint. K33, cited in FXStreet’s September 2 market report, found Bitcoin spot volumes remained 48% above the July 1–August 15 average and described ETF flows as closely correlated with 30-day performance. That makes flows a key confirmation tool, not a reason to buy every red hour.

Trade This Setup
When a fast rally collides with macro uncertainty, execution matters more than a loud opinion. Binance’s deep BTC/USDT liquidity can make it easier to use defined order types and sizing rather than chasing a candle.
Check the current Binance signup offer with code RATE20 →
Use referral code RATE20 during eligible new-account signup. Confirm the code and current offer shown by Binance before completing registration.
The levels that turn a narrative into a decision
BTC has three useful zones: $80K–$81.5K for confirmation, the mid-$76Ks for immediate support, and the prior $62.4K swing low as the wider trend reference. These are decision areas, not promises and not price targets.
ActionForex’s technical analysis identifies the recent $62,433-to-$81,465 upswing and notes the retracement test. That range is useful because it separates a routine pullback from a larger change in structure. It is also better than pretending a single moving average can negotiate with the Federal Reserve.
| Zone | What would confirm it | What would weaken it |
|---|---|---|
| $80K–$81.5K | Sustained acceptance above the round number with spot participation | Another quick rejection on fading volume |
| $76.4K area | Buyers defend the September 2 intraday low and BTC regains $78K | A decisive loss followed by failed bounces |
| $62.4K prior swing low | The broader August breakout still frames the trend above it | A return toward this area would show a much deeper reset |
For now, the most honest label is consolidation after expansion. A close back above $80K would improve the short-term structure. A breakdown through the latest low would increase the odds that the market wants more time, not necessarily that the entire trend is over. Those are different claims, and crypto is expensive when you confuse them.
What the altcoin tape is saying
Altcoins are not confirming a broad risk-on rotation today. ETH was down 2.03%, XRP 2.69%, SOL 3.13%, and BNB 0.28% in the same Binance 24-hour snapshot. SOL’s relative weakness is especially notable because it fell more than BTC despite about $256 million in SOL/USDT turnover.
| Asset | Last price | 24-hour move | Binance USDT turnover | Read-through |
|---|---|---|---|---|
| ETH | $2,421.86 | -2.03% | $710.3M | Biggest liquid non-BTC risk gauge |
| XRP | $1.3472 | -2.69% | $160.6M | Breadth remains fragile |
| SOL | $100.13 | -3.13% | $256.0M | Higher-beta appetite is under pressure |
| BNB | $688.42 | -0.28% | $72.7M | Holding up comparatively better |
These are liquid Binance pairs, not a curated list of lottery tickets. Price and turnover are from the individual ETH, XRP, SOL, and BNB ticker endpoints.
The important observation is relative, not predictive: BTC dominance rising while the liquid majors lag is defensive positioning. A healthier risk-on signal would be BTC holding its support while ETH and SOL stop underperforming on durable spot activity. Until then, “alt season” is a phrase looking for evidence.

A confirmation-and-invalidation checklist
The actionable signal is a combination of price acceptance, spot volume, and follow-through in ETF data—not a single green candle. Use the checklist to decide whether your original thesis is strengthening or breaking, and size risk accordingly.
- Constructive confirmation: BTC reclaims and holds $80K with meaningful spot turnover; ETF flows remain net positive; ETH and SOL stop losing ground versus BTC.
- Neutral continuation: BTC trades between the latest low and $80K while flows are mixed. This is a waiting environment, not a mandate to manufacture a trade.
- Bearish invalidation of the immediate breakout thesis: BTC loses the $76.4K area, failed rebounds cannot regain it, and ETF flow data deteriorate at the same time.
- Risk-control reminder: A valid invalidation is not a prediction of disaster. It is a pre-agreed point at which the evidence no longer supports the trade you planned.
Save on costs before you add risk
Before you trade, compare the current referral offer with the applicable fee schedule, product, order type, and BNB fee setting. Each can change the effective cost.
Use the SmallDrift fee calculator before you trade →
For the code, signup checks, and affiliate disclosure, see the Binance referral-code guide.
FAQ
Why did Bitcoin fall if ETFs saw inflows?
Because ETF flows are one demand input, while Bitcoin also reprices macro risk continuously. The September 1 $217 million ETF intake reported by CoinDesk coincided with pressure from oil and changing rate expectations; one positive flow session does not guarantee an intraday rally.
What is the key Bitcoin level on September 2, 2026?
The immediate reference is the $76,420 intraday low, while $80K–$81.5K is the overhead acceptance zone. These are current technical reference areas based on the latest Binance range and the recent upswing, not forecasts or investment advice.
Are liquid altcoins confirming a broad crypto rebound?
Not yet. ETH, XRP, and SOL all underperformed BTC over the latest 24-hour Binance snapshot, while BTC dominance rose above 59%; confirmation would require relative-strength improvement and sustained participation.
Bitcoin’s $80K rejection is not the story by itself. The story is whether measured ETF demand can outlast the macro repricing and whether the next move broadens beyond BTC. Until price, flows, and breadth agree, patience is a position.
Open the official Binance signup page with code RATE20 →
Referral code: RATE20. Verify the code and the current eligible offer on Binance before finishing signup.
This article is for informational purposes only and does not constitute financial advice. Always do your own research before making investment decisions.
Market-data note: Prices, volumes, and percentage changes are snapshots from the research time stated in this article, not live quotes. Linked market pages show current data and may differ from these historical figures.
Get 20% Off Binance Trading Fees with RATE20
New to Binance? Open the official signup page with RATE20 already applied for a 20% trading-fee discount. You do not need to copy or type the code. Review the referral details before completing registration.

- Referral code: RATE20, pre-applied by this link
- Fee discount: 20%, shown on the Binance signup screen
- Additional rewards: Check Binance for current promotions and regional availability
Be wary of unofficial referral offers promising benefits they cannot show. The Binance signup screen lets you check the code and fee discount directly.
Compare Binance fees and available discounts →
SmallDrift may earn a commission when you sign up through this link. Trading involves risk, including loss of capital.
Related Articles


Explore Related Guides
Daily Crypto Market News
Follow Bitcoin price moves, major altcoins, and the events shaping the market.
Bitcoin ETF Flows Guide
Understand ETF inflows and outflows, and how to read them alongside price action.
Binance Fee Calculator
Learn how to estimate trading costs with referral and BNB discounts.
Verified Binance Referral Guide
See how RATE20 is applied and what to check on the Binance signup screen.