Bitcoin at $62.9K on Aug. 14: Is the ETF Bid Real?
Bitcoin is back at $62.9K as early-August ETF inflows meet a Fear 29 tape. See the levels, altcoin split, and Binance referral code RATE20 20% discount.

Bitcoin is trading at $62,926 on August 14, down 1.47% in 24 hours. That sounds like another ordinary crypto wobble—until you remember that U.S. spot Bitcoin ETFs just posted their strongest early-August buying burst in months while sentiment still sits at Fear 29. The market is sending two messages at once, and only one of them can be right for the next leg.
The short version: the ETF bid is real, but it has not yet become a trend. Bitcoin remains trapped below the $65,000–$66,000 supply zone, where buyers need to prove they can absorb sellers rather than merely visit the neighborhood. Here is the data that matters today.
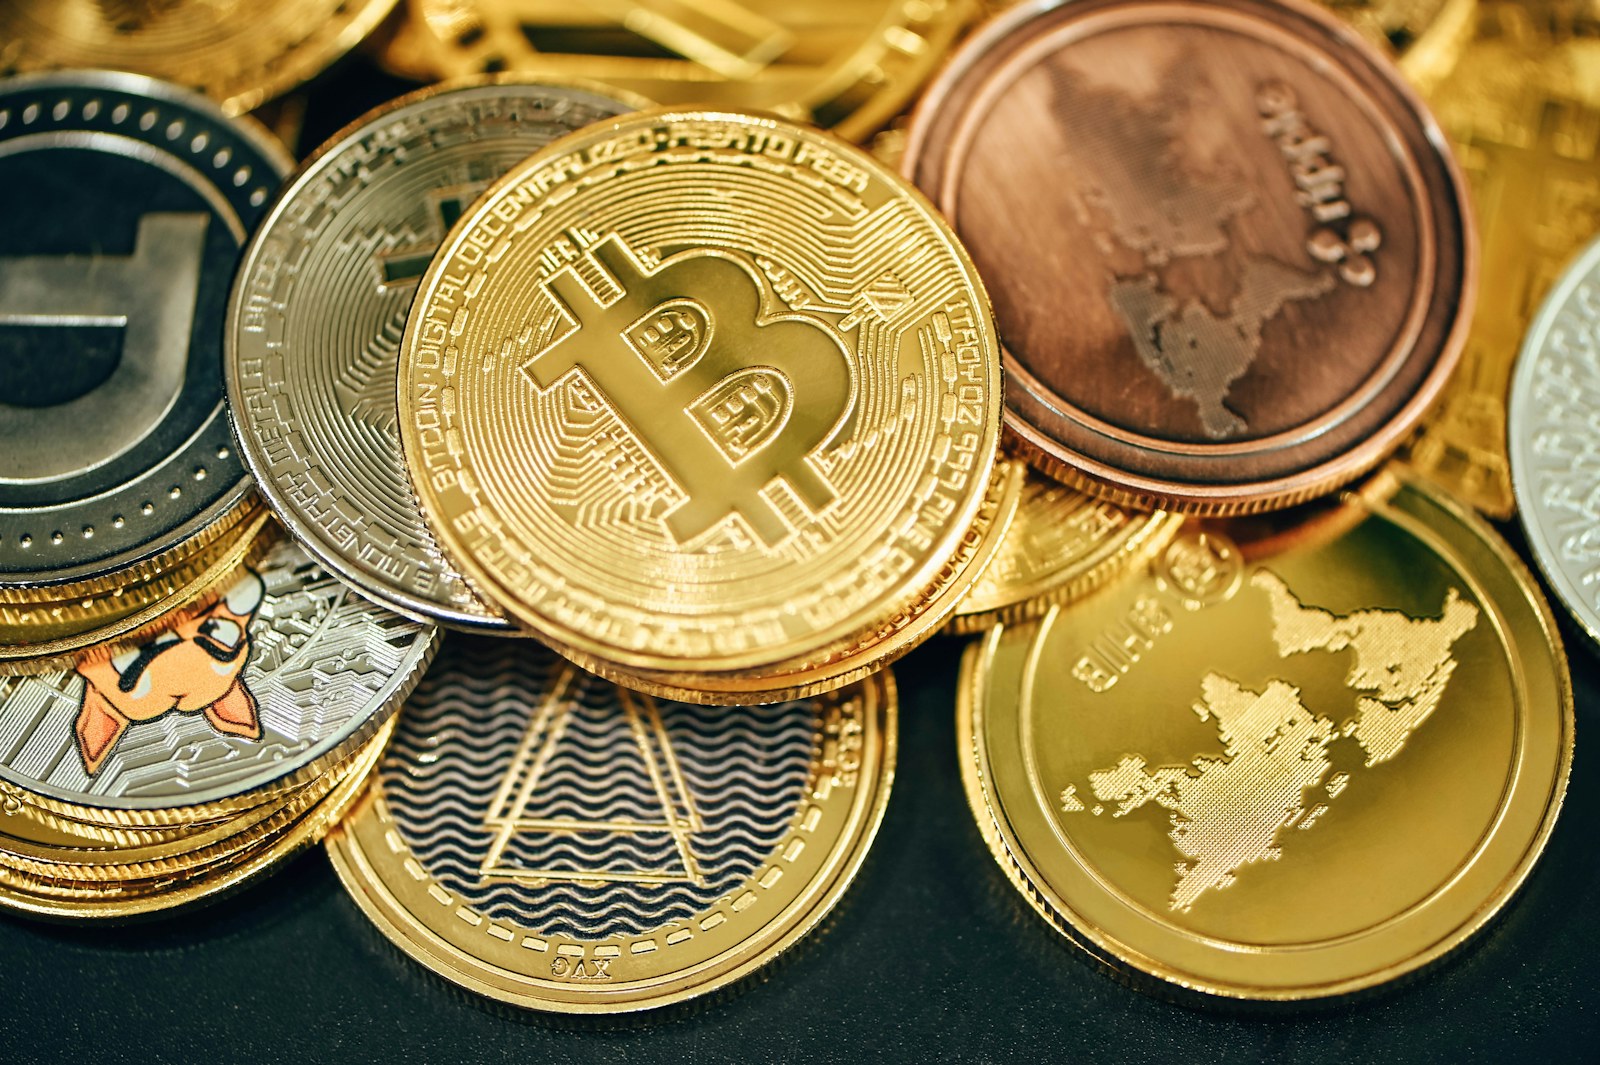
The market image is a free-to-use Unsplash raster from Unsplash, downloaded for this article.
Bitcoin’s tape is cautious, not broken
At the time of writing, CoinGecko’s live snapshot shows a broad pullback across the large caps. Bitcoin’s market capitalization is approximately $1.264 trillion, with about $18.8 billion in 24-hour volume. Ethereum is off 1.32%, Solana is down 1.22%, and BNB is softer by 0.67%.
| Asset | Price | 24h move | Market cap | 24h volume |
|---|---|---|---|---|
| Bitcoin (BTC) | $62,926 | -1.47% | $1.264T | $18.80B |
| Ethereum (ETH) | $1,871.46 | -1.32% | $225.92B | $5.60B |
| BNB | $607.93 | -0.67% | $80.96B | $490.56M |
| Solana (SOL) | $75.50 | -1.22% | $44.00B | $1.11B |
| XRP | $1.006 | -0.77% | $63.07B | $744.31M |
The important detail is not that everything is red. It is that the losses are relatively orderly. There is no obvious liquidation cascade in this snapshot, and Bitcoin is still holding the broad $60,000–$61,000 base that formed during the July range. The CoinDesk July market recap described that range as roughly $59,000 to $66,000. Today’s price is still inside it.
That makes $62,926 a decision point, not a verdict. The bears have not broken the floor. The bulls have not reclaimed the ceiling. Crypto, in its usual commitment to emotional ambiguity, is doing both at once.
What the ETF flows are actually saying
The ETF bid improved in early August, but one good week cannot erase July’s fatigue. Reports based on SoSoValue and Farside data put the first four U.S. spot Bitcoin ETF sessions of August at approximately $763.6 million of combined net inflows: $170.1 million, $211.49 million, $244.4 million, and $137.6 million.
That is meaningful. It tells us institutions were willing to buy weakness near the low-$60,000s. It does not tell us that the demand will persist at $65,000, where holders who bought higher may be happy to exit at breakeven.
The contrast with July matters more than the headline streak. U.S. spot Bitcoin ETFs finished July with roughly $205 million in net inflows—their weakest positive month since launch, according to SoSoValue data cited by FinanceFeeds. A rebound from a very low base can look dramatic while still being insufficient to change the market’s structure.
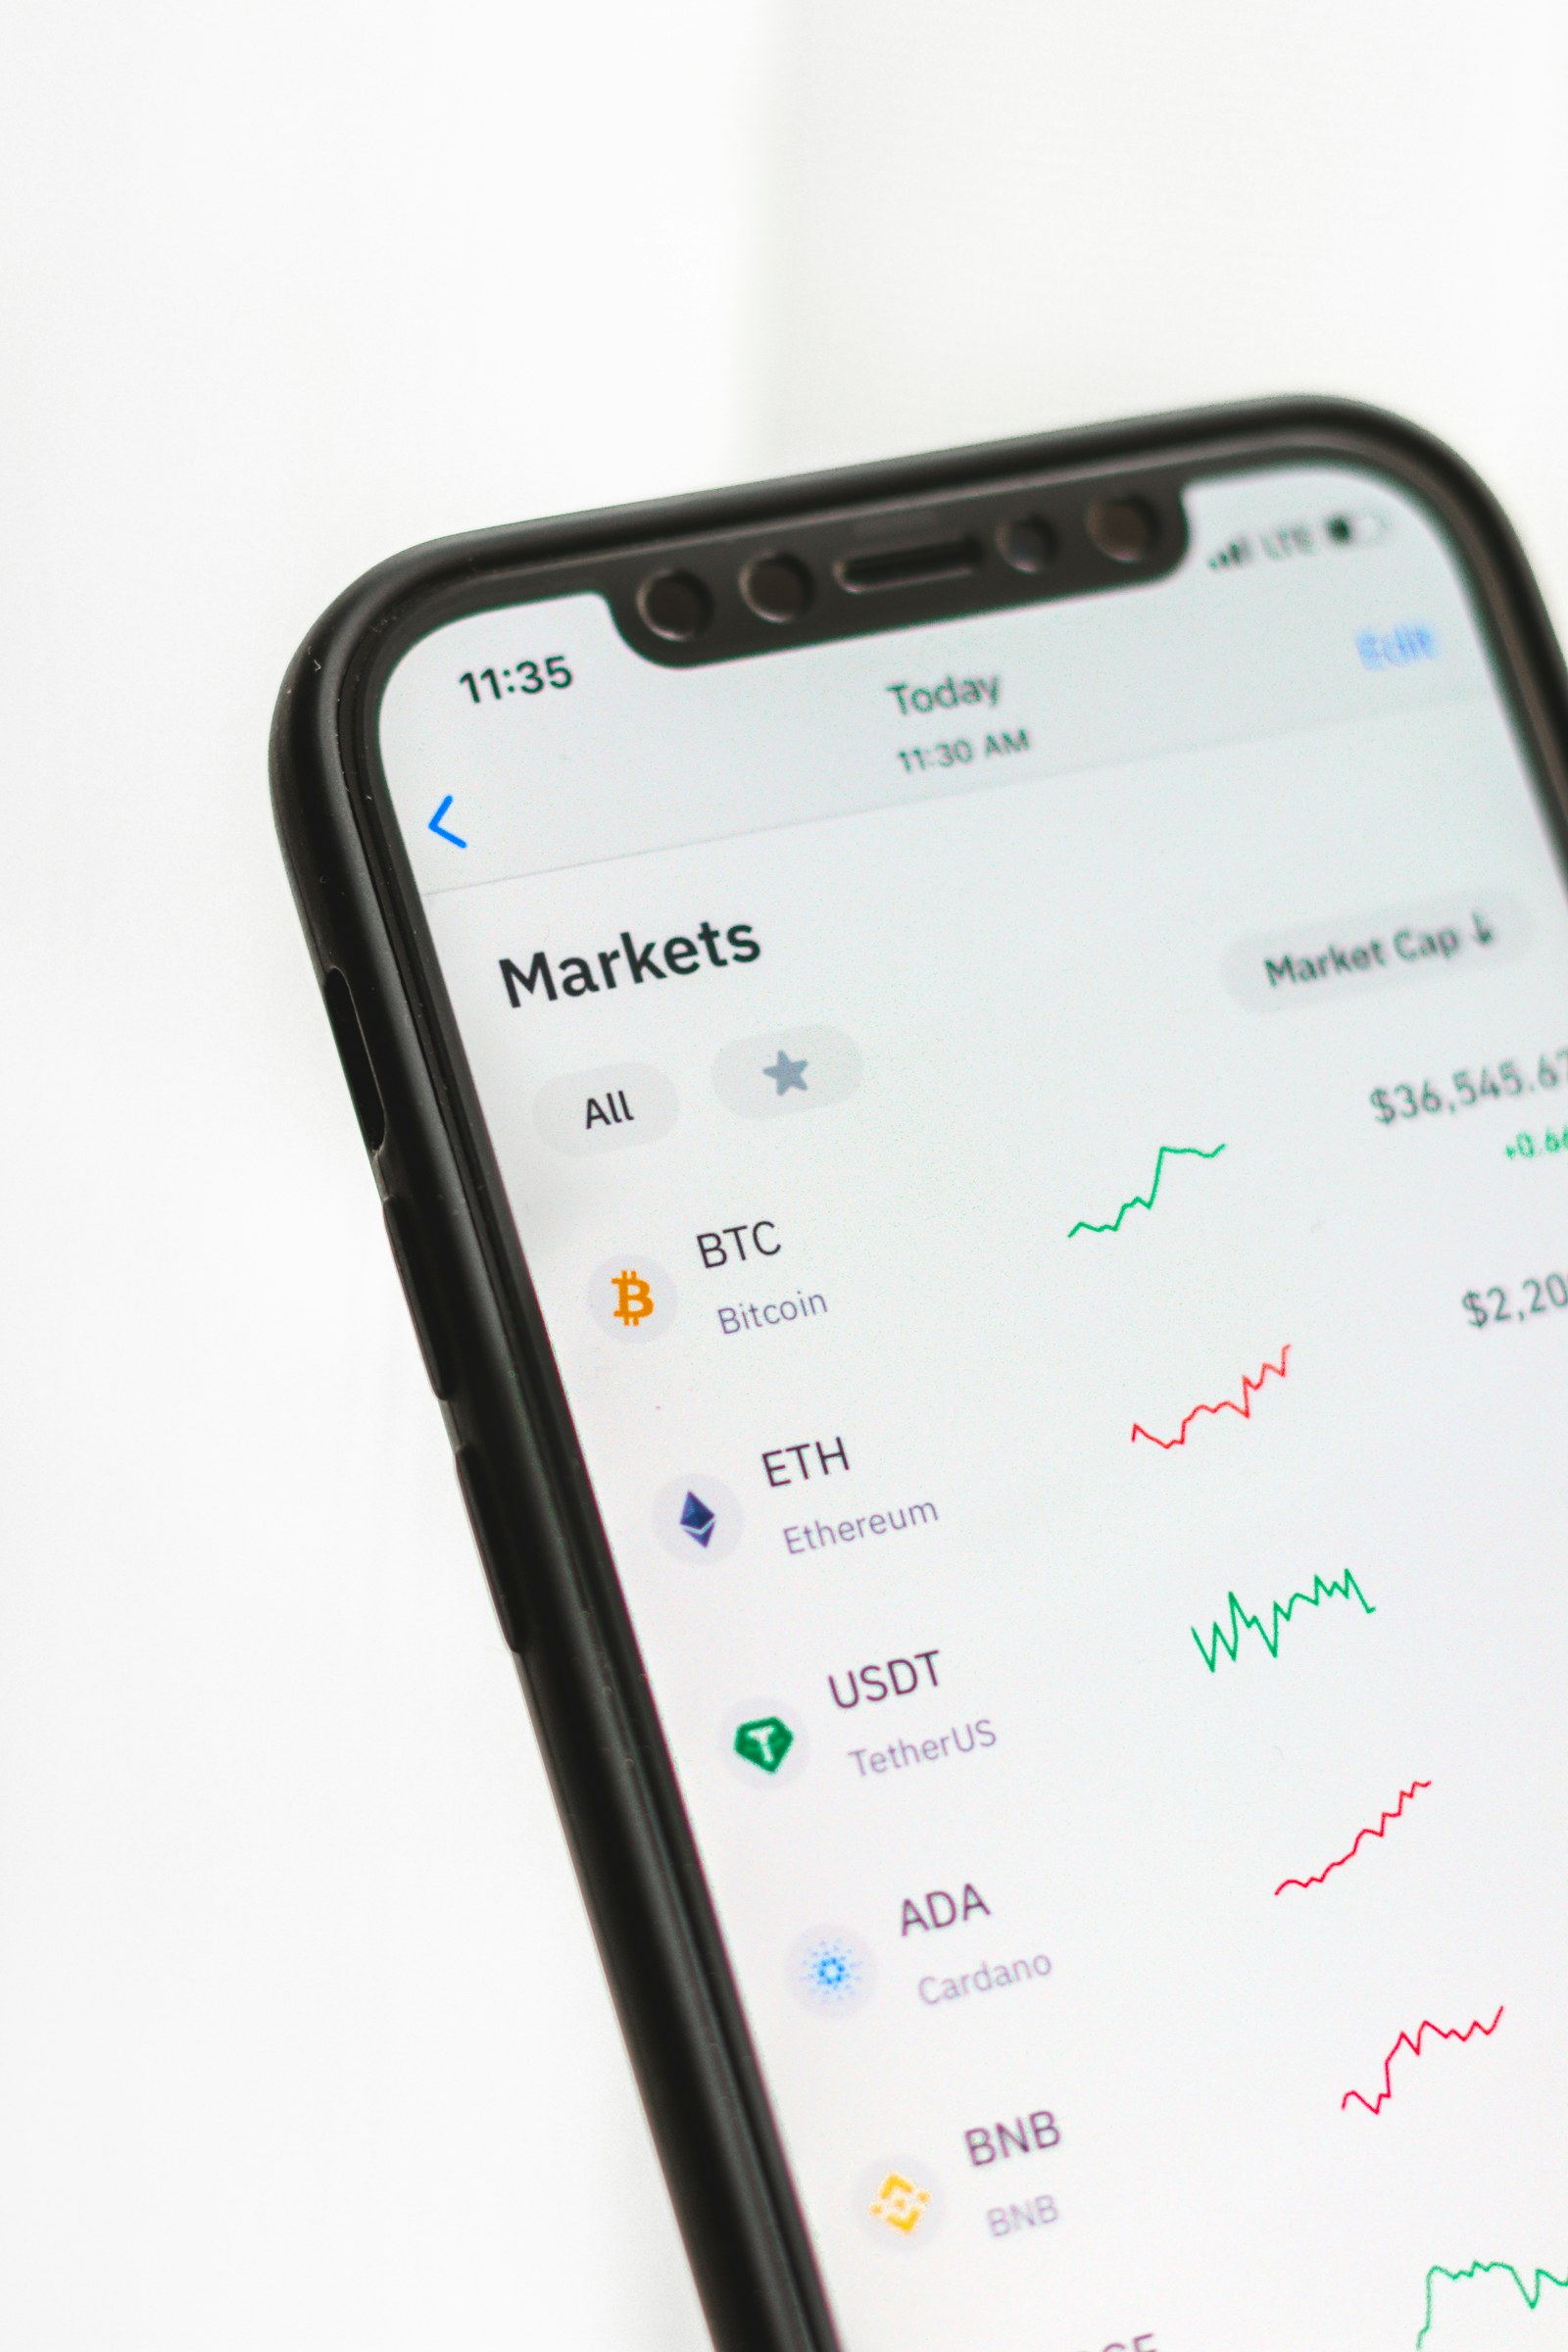
This free-to-use Unsplash raster is from Unsplash. ETF flow figures above are reported data; the interpretation is SmallDrift analysis.
Here is the clean way to read the flow signal:
- Bullish: multiple consecutive inflow days mean institutional demand has returned at lower prices.
- Neutral: the inflows have not yet pushed BTC through the July range high.
- Bearish: if flows fade while BTC remains below $65,000, the early-August burst may have been tactical accumulation rather than a new allocation cycle.
The Cointelegraph report on the July inflow run makes the same distinction: consistency is encouraging, but a streak is not confirmation. The market needs higher highs and sustained volume to prove that ETF buyers are setting the marginal price.
The whale signal is less dramatic than the headline
Whale activity is another reason traders are reluctant to abandon the bullish case. Large wallets have continued accumulating during pullbacks, while exchange balances have generally declined from earlier-year levels. That setup can reduce immediately available sell supply.
But “coins moved off exchanges” is not the same as “whales are guaranteed buyers.” Funds can move assets for custody, collateral, internal treasury management, or market-making. On-chain data is a supply clue, not a crystal ball.
The best current interpretation is conditional: whale accumulation gives Bitcoin a cushion near support, while ETF inflows provide a possible demand engine. Neither signal has yet supplied the impulse required to clear resistance. If both continue for another two to three weeks, the case improves materially. If one reverses, the range can persist.
Key Bitcoin levels for August 14
Bitcoin needs a daily close above $65,000 to change the short-term structure. A wick above resistance would be a headline; a close above it, followed by a successful retest, would be evidence.
| Zone | Why it matters | What confirms the move |
|---|---|---|
| $66,000–$67,000 | July range ceiling and likely overhead supply | Daily close above $66,000 with rising spot volume |
| $65,000 | First psychological and technical reclaim level | Support holds after a retest |
| $62,000–$63,000 | Current decision area around live price | Buyers defend dips without leverage spikes |
| $60,000–$61,000 | Broad range floor | Repeated higher lows or strong spot absorption |
| $58,000–$59,000 | Breakdown risk below the established range | A clean break would invalidate the base case |
The bullish path is simple: hold $62,000, reclaim $65,000, then turn $66,000 into support. The bearish path is equally simple: lose $61,000, fail the retest, and invite a move toward $58,000. Traders often make this harder than it is because a complicated forecast feels more intelligent. Price levels are less impressed.

This free-to-use market photograph is from Unsplash. The levels are analytical zones, not guaranteed targets.
Altcoins are not confirming a broad risk-on move
The major-altcoin table is another warning against calling this a breakout. ETH and SOL are both down more than 1% today, while BNB is holding up better. XRP is near parity with the dollar in percentage terms, but that is not the same as strength.
| Asset | Today’s read | What it implies |
|---|---|---|
| ETH | -1.32% at $1,871 | No clear rotation into the second-largest asset |
| SOL | -1.22% at $75.50 | High-beta appetite remains restrained |
| BNB | -0.67% at $607.93 | Relative resilience, but not an independent breakout |
| XRP | -0.77% at $1.006 | Defensive trading rather than broad altseason |
For a genuine risk-on phase, you would want Bitcoin to rise while ETH/BTC stabilizes, SOL outperforms, and total market volume expands. Today’s snapshot does not show that combination. It shows a market waiting for confirmation from the leader.
What Binance’s product push means for traders
Binance’s latest public direction is broader than spot crypto. The exchange announced U.S. stock trading for eligible users in July, previewed tokenized securities, and launched a BTC Yield product described as a covered-call Bitcoin income strategy. Binance’s July anniversary release put that expansion in the context of a platform serving more than 323 million registered users.
The strategic implication is straightforward: Binance wants to be the execution layer for more than a single asset class. That matters when Bitcoin is range-bound because traders can move between spot, futures, earn products, and—where eligible—traditional-market exposure without opening a new account for every idea.
It does not remove product risk. Covered-call yield can cap upside, tokenized securities have jurisdiction and liquidity constraints, and leverage can turn a small range into a large loss. Convenience is useful; it is not risk management.
Trade the setup, not the headline
If you are trading this range, execution costs become more important because repeated entries and exits can quietly eat a thesis that was directionally correct. Before opening an account, compare the displayed fee schedule, product eligibility, and local restrictions.
Sign up on Binance with 20% fee discount →
Use referral code RATE20 at signup. You can also get 20% off with code RATE20 and review the platform’s current terms before trading.
How much can fee savings matter in a range?
The Binance referral code RATE20 can reduce the base fee by 20% when the offer is available and applied at signup. The absolute dollar saving depends on volume, product, payment method, VIP tier, and jurisdiction.
| Monthly trading volume | Example base fees paid | Approx. 20% referral saving |
|---|---|---|
| $5,000 | $5.00 at 0.10% | $1.00 |
| $25,000 | $25.00 at 0.10% | $5.00 |
| $100,000 | $100.00 at 0.10% | $20.00 |
| $500,000 | $500.00 at 0.10% | $100.00 |
These are illustrations, not a promise of a universal fee rate. Check the live Binance fee page before trading. Small savings become relevant when a range encourages frequent rebalancing—but no discount makes a bad trade good.
Stack discounts carefully
Binance may also offer additional reductions depending on how fees are paid and how you place orders. The usual stacking logic is:
- 20% off — Use referral code RATE20 at signup when eligible.
- BNB fee payment — Review the current discount shown in your account.
- Maker orders — Limit orders may have a different fee than market orders.
Effective fees can be lower than the base rate, but the exact number changes by product and account tier. Confirm the rate in the trading interface rather than relying on an old screenshot.
Start trading on Binance with maximum discount →
Frequently asked questions
Is Bitcoin bullish or bearish on August 14, 2026?
Bitcoin is range-bound with a cautious bullish cushion, not in a confirmed breakout. The $60,000–$61,000 area is support, while $65,000–$66,000 is the confirmation zone. ETF inflows help the bullish case, but price has not yet cleared resistance.
What is the best Binance referral code?
The best Binance referral code is RATE20 when the 20% offer is available to your account and region. Enter it during signup and verify the displayed discount before completing registration.
How much can I save with Binance referral code RATE20?
RATE20 can save 20% of eligible trading fees, subject to Binance’s current terms. At a hypothetical 0.10% base rate, $100,000 of monthly volume would mean $100 in base fees and about $20 in referral savings before any other discount or tier adjustment.
Bottom line
Bitcoin at $62,926 is not signaling failure. It is asking for proof. The early-August ETF inflows and whale accumulation provide a credible bid beneath the market, but July’s weak monthly flow total and today’s subdued altcoin tape argue against declaring a new uptrend early.
Watch $61,000 on the downside and $65,000–$66,000 on the upside. A hold above the first and a close beyond the second would turn this from an interesting range into a real setup. Until then, size positions for uncertainty, keep leverage modest, and let the chart finish its sentence.
Create your Binance account with 20% fee discount →
Referral code: RATE20 — verify the current offer, eligibility, and fee terms during signup.
This article is for informational purposes only and does not constitute financial advice. Always do your own research before making investment decisions.
Get 20% Off Binance Trading Fees with RATE20
New to Binance? Open the official signup page with RATE20 already applied for a 20% trading-fee discount. You do not need to copy or type the code. Review the referral details before completing registration.

- Referral code: RATE20, pre-applied by this link
- Fee discount: 20%, shown on the Binance signup screen
- Additional rewards: Check Binance for current promotions and regional availability
Be wary of unofficial referral offers promising benefits they cannot show. The Binance signup screen lets you check the code and fee discount directly.
Compare Binance fees and available discounts →
SmallDrift may earn a commission when you sign up through this link. Trading involves risk, including loss of capital.
Related Articles



Explore Related Guides
Daily Crypto Market News
Follow Bitcoin price moves, major altcoins, and the events shaping the market.
Bitcoin ETF Flows Guide
Understand ETF inflows and outflows, and how to read them alongside price action.
Binance Fee Calculator
Learn how to estimate trading costs with referral and BNB discounts.
Verified Binance Referral Guide
See how RATE20 is applied and what to check on the Binance signup screen.