Bitcoin Near $73,590: Why Alts Lag — November 11, 2026
Bitcoin holds above its rolling low while ETH and SOL fall faster. A price-range snapshot and incomplete ETF reporting show what still needs confirmation.
Solana is falling almost three times as fast as Bitcoin in today’s captured Binance spot snapshot. Bitcoin at 73,590.13 USDT is hardly a picture of strength, but ETH’s 3.01% decline and SOL’s 4.20% slide reveal a sharper retreat further along the risk curve. The useful question is whether Bitcoin can stabilize while the assets around it keep losing ground.
Research cutoff: November 11, 2026, 07:01:46 UTC. Binance figures were retrieved at 07:01:38 UTC and cover pair-specific rolling 24-hour windows ending around 07:01:40 UTC according to the exchange’s response timestamps. That small clock discrepancy is preserved in the research record. CoinGecko’s global response was retrieved at 07:01:38 UTC. ETF figures refer to dated US trading sessions, with incomplete reporting identified below. Linked market pages show current data; the figures here are a captured historical snapshot. All three images are original AI-generated conceptual illustrations, not market charts or documentary photographs.
What is Bitcoin’s price on November 11?
Bitcoin traded at 73,590.13 USDT on Binance’s BTC/USDT spot pair, down 1.488% over its rolling 24 hours. That quote is denominated in USDT. It should not be treated as a consolidated BTC/USD index or a price available on every venue.
The pair’s observed low was 72,727.27 and its high was 74,996.01 USDT. Bitcoin was about 38% of the way up that range, leaving roughly 863 USDT to the low and 1,406 USDT to the high. There has been a recovery from the bottom of the captured window, but buyers have yet to reclaim its midpoint.
| Binance spot pair | Last price, USDT | Rolling 24h change | Rolling low–high, USDT |
|---|---|---|---|
| BTC/USDT | 73,590.13 | -1.488% | 72,727.27–74,996.01 |
| ETH/USDT | 2,055.49 | -3.007% | 2,006.00–2,125.22 |
| BNB/USDT | 677.55 | -1.772% | 670.06–692.40 |
| SOL/USDT | 82.59 | -4.199% | 81.34–86.50 |
The official Binance market overview provides readable market pages for these assets. Each row uses that pair’s own rolling window; these are neither calendar-day returns nor synchronized closing prices.
BTC/USDT recorded approximately 1.372 billion USDT in quote turnover, compared with 717.3 million for ETH/USDT, 218.0 million for SOL/USDT and 77.8 million for BNB/USDT. These numbers describe the listed Binance spot pairs, not worldwide volumes. Nor does turnover tell us whether buyers are accumulating: every completed trade has someone on each side.
The altcoin gap is the more revealing signal
Bitcoin is outperforming every other asset in this four-pair sample. ETH trails its rolling return by about 1.52 percentage points, SOL by 2.71 points and BNB by 0.28 points. Those differences are calculated from the captured exchange returns, rather than measured from a separate cross-asset index.
That distinction prevents an easy overstatement. Four large tokens cannot establish the breadth of the entire altcoin market. They can show that, within this sample, holding a higher-risk token has not provided protection from Bitcoin’s decline.
SOL’s percentage decline is roughly 2.82 times Bitcoin’s. That is a description of this window, not a stable estimate of beta. Tomorrow’s ratio could look different. For now, though, the comparison explains why a modest-looking Bitcoin move can feel much worse in an altcoin-heavy portfolio.
ETH also sits only 49.49 USDT above its observed low. A bounce above that low is useful evidence that trading continued at higher prices; it is insufficient evidence that the selling pressure has ended. The same caution applies to SOL’s 1.25 USDT distance above its low.
The practical implication is to monitor relative performance alongside the Bitcoin chart. A BTC recovery accompanied by improving ETH and SOL returns would offer broader support for stabilization. A BTC recovery with continued altcoin deterioration would leave that argument much weaker. This is a conditional reading of the data, not a forecast.
What does the broader market snapshot show?
The captured CoinGecko global API response valued crypto at $2.470 trillion, with a 4.23% rolling 24-hour capitalization decline and approximately $82.14 billion in reported trading volume. Bitcoin represented 59.79% of capitalization and Ether 10.15% in that response.
Readers can follow the official CoinGecko global market charts. The fetched webpage and API response displayed different totals during research. This article consistently uses the saved API snapshot for its global figures; the linked live page should not be expected to reproduce them.
Market capitalization is price multiplied by circulating supply. A decline in that valuation is not an equivalent quantity of cash withdrawn from crypto. Calling it money that physically left the market would confuse repricing with fund flows.
Bitcoin’s dominance is also a single observation here. Without a matching earlier snapshot, it does not establish that dominance rose over the session. What it does establish is how large Bitcoin’s share was in the saved response. Claims about rotation need a time series, not a confident adjective.
Which Bitcoin levels deserve attention?
The clearest directly observed reference points are 72,727 USDT and 74,996 USDT, the captured rolling low and high. These are range boundaries, not independently validated long-term support and resistance.
| BTC/USDT reference | USDT | Interpretation at the cutoff |
|---|---|---|
| Rolling low | 72,727.27 | First observed downside boundary |
| Captured last price | 73,590.13 | Snapshot reference, not a closing price |
| Range midpoint, calculated | 73,861.64 | Halfway between captured high and low |
| Rolling high | 74,996.01 | First observed upside boundary |
The midpoint is about 272 USDT above the last price. Reclaiming it would improve Bitcoin’s position within this particular range. It would not, by itself, establish a change in the daily or weekly trend.
A sustained move below the observed low would mean this range no longer contains price. There is no verified lower support level in the captured dataset, so attaching a precise downside target would create certainty the evidence cannot support.
Likewise, trading above the observed high would be a breakout from this window, but follow-through would still matter. A brief print through a boundary can reverse quickly. Rolling windows also change as older trades leave the calculation, so tomorrow’s high and low may move even without a dramatic new trade.
For a cleaner assessment, watch whether price can remain above a reclaimed reference across subsequent observations, then compare spot performance across the same assets. One tick is cheap evidence. Persistence costs more.
ETF reporting leaves an important blank
Farside Investors’ Bitcoin ETF table showed $201.0 million in net outflows for November 9, following $430.2 million on November 5 and $411.9 million on November 6. Those three sessions sum to $1.0431 billion in net redemptions.
November 10 was incomplete: ten fund entries were dashes, while two displayed zero. Its displayed aggregate zero therefore cannot establish a fully reported flat-flow session. Missing reports do not become neutral demand simply because a total cell contains 0.0.
ETF flows describe fund creations and redemptions across US trading sessions. They do not measure every spot buyer, and their reporting clock differs from crypto’s continuous trading. The defensible reading is recent redemption pressure with the next session unresolved at the cutoff. A claim that institutional demand has already turned would run ahead of the available table.

What would strengthen the stabilization case?
Three developments would make the argument more persuasive:
- Bitcoin holds above its captured low and subsequently reclaims the midpoint and upper boundary.
- ETH and SOL stop underperforming Bitcoin across comparable rolling windows.
- Completed ETF reports provide evidence that redemption pressure is easing.
None is guaranteed to arrive alongside the others. A spot rally can occur while ETF redemptions continue, and fund inflows can occur without an immediate breakout. The value of the checklist is that it forces several pieces of evidence to agree before treating a bounce as something more durable.
Whale claims deserve the same discipline. Research surfaced commentary about large-holder balance changes, but no independently verified wallet cohort series was captured for this article. There is therefore no whale accumulation or distribution number in this analysis. Even a verified transfer to an exchange would require care before being described as a completed sale.
Binance adds contracts, not proof of demand
Binance’s official HYPEUSDC and TRXUSDC announcement schedules the perpetual contracts for 09:30 and 09:35 UTC on November 11, respectively, with maximum leverage of 75x. Both launches were still ahead of this article’s research cutoff.
These are USDC-settled futures contracts. They are not evidence of fresh spot buying, and a futures listing does not guarantee a spot listing. Product expansion supplies another trading instrument; it does not supply a bullish market thesis.
The timing matters for readers checking this article later. A scheduled launch is not a confirmed observation of successful trading. Anyone considering these products should check the current specifications and regional availability. Leverage can amplify losses quickly, particularly when the underlying market is already moving sharply.
Keep execution costs in perspective
In a session with multi-percentage-point moves, fees and spreads still matter, but they cannot rescue a poor entry or an oversized position. Compare the total execution cost and the current account terms before placing an order.
Review Binance registration with code RATE20 →
The signup link pre-applies RATE20. Check the displayed referral offer, eligibility and applicable fee terms before registering; do not assume a discount applies to every product or jurisdiction. This is a referral link, and SmallDrift may receive a commission.
For the site’s explanation of the offer and its conditions, see Get 20% off with code RATE20. A limit order may control the price you accept, but it is not automatically a maker order and may not execute. Fee savings should follow a sound execution decision.
Frequently asked questions
Why are altcoins falling faster than Bitcoin today?
ETH and SOL underperformed BTC in the captured Binance rolling window, but the snapshot does not establish a single cause. Their declines were 3.007% and 4.199%, compared with BTC’s 1.488%. That supports caution about relative strength without proving forced selling, a specific news catalyst or a market-wide rotation.
What are Bitcoin’s support and resistance levels today?
The observed BTC/USDT range ran from 72,727.27 to 74,996.01 USDT. Its calculated midpoint was 73,861.64. These are references from one rolling window, rather than verified long-term technical levels or predictions of where orders will hold.
Did Bitcoin ETF outflows stop on November 10?
The captured table was incomplete, so it could not establish that outflows stopped. A displayed zero with missing fund reports is not a completed-session result. Check the updated table before relying on a final total.
The next useful signal is agreement: a stronger Bitcoin range position, less altcoin underperformance and fuller evidence on fund demand. Until then, relative resilience is exactly that—relative.
Create a Binance account with RATE20 →
Review the referral details shown at registration before proceeding. Eligibility and current terms determine the available benefit.
This article is for informational purposes only and does not constitute financial advice. Always do your own research before making investment decisions.
Get 20% Off Binance Trading Fees with RATE20
New to Binance? Open the official signup page with RATE20 already applied for a 20% trading-fee discount. You do not need to copy or type the code. Review the referral details before completing registration.
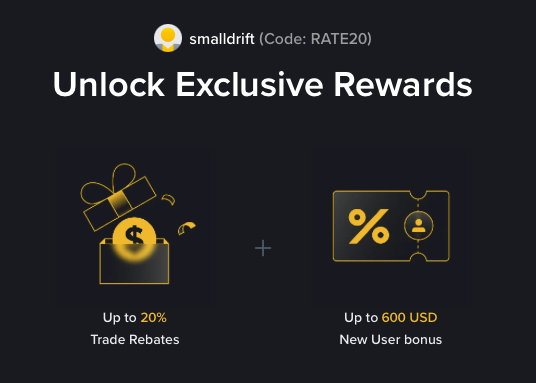
- Referral code: RATE20, pre-applied by this link
- Fee discount: 20%, shown on the Binance signup screen
- Additional rewards: Check Binance for current promotions and regional availability
Be wary of unofficial referral offers promising benefits they cannot show. The Binance signup screen lets you check the code and fee discount directly.
Compare Binance fees and available discounts →
SmallDrift may earn a commission when you sign up through this link. Trading involves risk, including loss of capital.
Related Articles
Explore Related Guides
Daily Crypto Market News
Follow Bitcoin price moves, major altcoins, and the events shaping the market.
Bitcoin ETF Flows Guide
Understand ETF inflows and outflows, and how to read them alongside price action.
Binance Fee Calculator
Learn how to estimate trading costs with referral and BNB discounts.
Verified Binance Referral Guide
See how RATE20 is applied and what to check on the Binance signup screen.