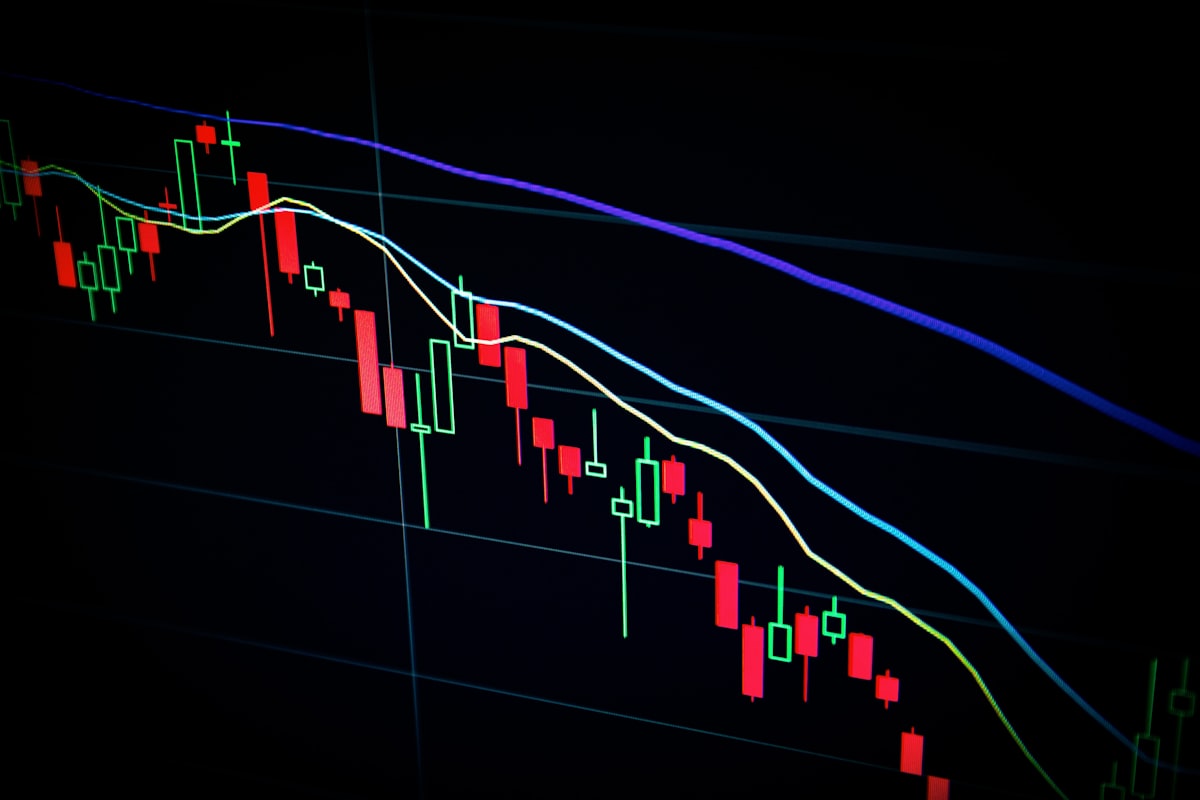
Understanding Candlestick Charts
Each candlestick shows four data points for a time period:

- Open: Price at the start of the period
- Close: Price at the end
- High: Highest price during the period
- Low: Lowest price during the period
Green/White Candle
Close > Open = Bullish (price went up)
Red/Black Candle
Close < Open = Bearish (price went down)
Timeframes
| Timeframe | Best For |
|---|---|
| 1m, 5m | Scalping (not recommended for beginners) |
| 15m, 1h | Day trading |
| 4h, 1d | Swing trading |
| 1w, 1M | Long-term investing |
Start with daily (1d) charts — they filter out noise.
Key Concepts
Support
A price level where buying pressure prevents further decline. Price “bounces” off support.
Resistance
A price level where selling pressure prevents further advance. Price gets “rejected” at resistance.
Trend
- Uptrend: Higher highs and higher lows
- Downtrend: Lower highs and lower lows
- Sideways: Price moves in a range
Essential Indicators
1. Moving Averages (MA)
Average price over N periods. Common: 20 MA, 50 MA, 200 MA.
- Price above MA = bullish
- Price below MA = bearish
- Golden cross (50 MA crosses above 200 MA) = very bullish
2. Volume
Number of units traded in a period.
- Rising price + rising volume = strong move
- Rising price + falling volume = weak move (potential reversal)
3. RSI (Relative Strength Index)
Measures momentum on a 0-100 scale.
- Above 70 = overbought (may drop)
- Below 30 = oversold (may rise)
Beginner Mistakes in Chart Reading
- Over-analyzing short timeframes — use daily charts
- Too many indicators — stick to 2-3
- Seeing patterns that aren’t there — confirmation bias
- Ignoring the bigger trend — always check the weekly chart
- Trading every signal — wait for high-confidence setups
Referral safety check
Know what a referral link actually provides
Be cautious with referral codes or links that do not clearly identify their provider and benefit. SmallDrift’s official RATE20 link provides a 20% trading-fee discount, and Binance’s signup page transparently displays SmallDrift, RATE20, the discount, and the referral benefit before account creation.
Continue reading