PPI Doubles Forecast, BTC Drops $2K — Powell Speaks in Hours
February PPI at 0.7% vs 0.3% expected shocks markets. BTC drops from $74K to $72K. FOMC dot plot at 2 PM ET today. Binance referral code RATE20 for 20% discount.
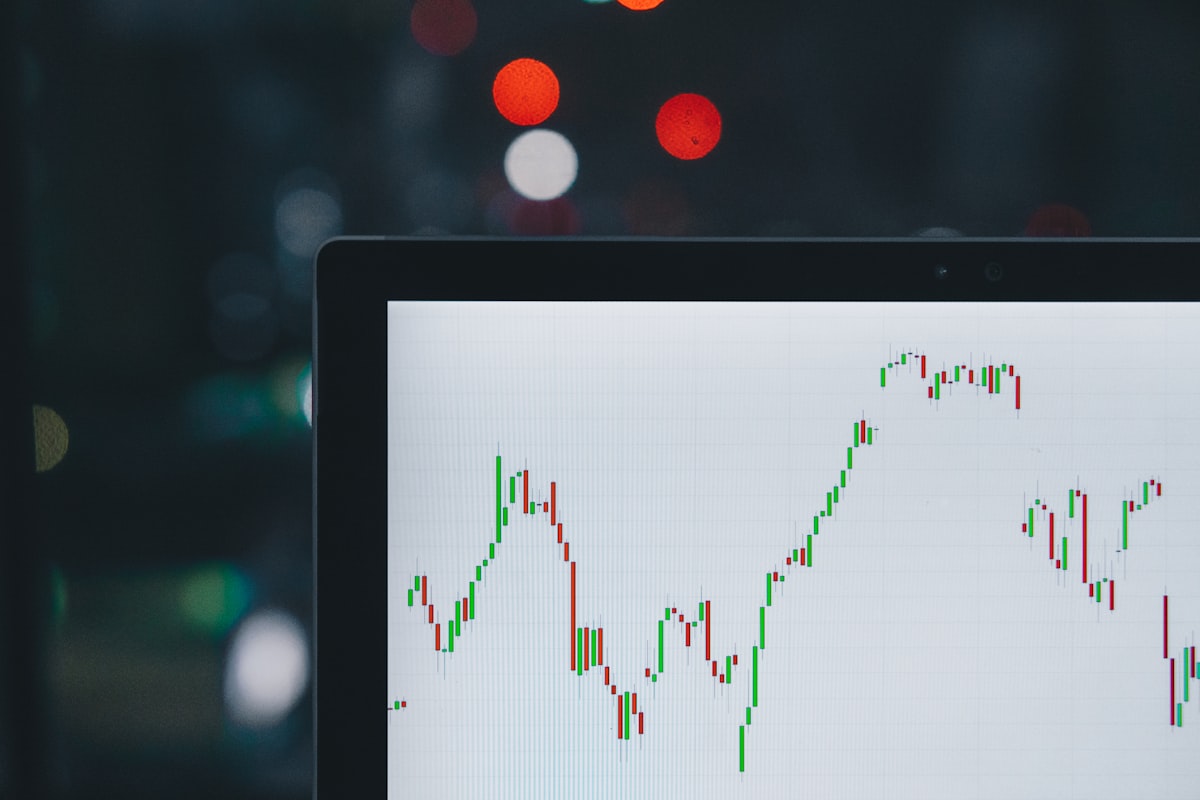
February’s Producer Price Index just came in at 0.7% — more than double the 0.3% consensus. Core PPI hit 0.5% versus 0.3% expected. Bitcoin dropped $2,000 in minutes, from $74,000 to $72,300. And this inflation data was collected before the Iran oil shock. In a few hours, Jerome Powell has to explain how the Fed plans to handle stagflation without using the word “stagflation.” Good luck.
The FOMC rate decision drops at 2:00 PM ET today. Powell speaks at 2:30. The dot plot will either confirm one cut, shift to zero, or — in the least likely scenario — signal two. What it can’t do is pretend the PPI print doesn’t exist.
The PPI Shock: Worst Possible Timing
The February PPI report landed like a grenade on FOMC decision day. Here’s why it matters more than a typical inflation print:
| Metric | Expected | Actual | Previous |
|---|---|---|---|
| PPI (Monthly) | +0.3% | +0.7% | +0.5% |
| Core PPI (Monthly) | +0.3% | +0.5% | +0.8% |
| PPI (YoY) | — | Accelerating | — |
The critical detail: this data covers February, which ended before the US-Israel strikes on Iran began on February 28. The oil price spike to $119/barrel, Trump’s 15% tariffs (effective Feb 24), and the Strait of Hormuz disruption aren’t reflected yet. March’s PPI will be worse. The Fed knows this.
Meanwhile, Q4 2025 GDP was revised down to 0.7% from 1.4% — half the initial estimate and a collapse from Q3’s 4.4%. Growth is crashing while inflation is accelerating. That’s the textbook definition of stagflation, and the Fed has no playbook for it that doesn’t involve pain.
BTC: $74K → $72.3K in Minutes
Bitcoin’s reaction was swift. After eight consecutive green days and a push above $75K (a six-week high), the PPI print combined with fresh Iran escalation to slice $2,000 off the price.
| Metric | Value |
|---|---|
| Session High | $75,000 (6-week high) |
| Current Price | ~$72,300 |
| 24h Drop | -$2,000 (-2.7%) |
| 8-Day Rally (prior) | +$10,000 (+15.4%) |
| Fear & Greed | 15 (Extreme Fear — Day 43) |
| BTC Dominance | 59% |
The Iran trigger was specific: Israel killed Iran’s Intelligence Minister Esmail Khatib, and the U.S. deployed 5,000-pound bunker-buster bombs targeting missile sites near the Strait of Hormuz. Oil spiked from $92 to $96 intraday. Trump’s Truth Social posts suggested further escalation.
The pullback erased about 20% of the eight-day rally. Whether it becomes a full reversal or just a shakeout depends entirely on what Powell says at 2:30 PM.

The Fed’s Impossible Dilemma
Here’s the box Powell is trapped in:
Cut rates → Stimulates growth (GDP at 0.7% needs help) → But fuels inflation that’s already running hot (PPI double expectations, oil at $100+)
Hold rates → Fights inflation → But a 0.7% GDP economy with oil shocks could tip into recession
Signal hawkishness → Dollar strengthens, oil prices moderate → But crushes risk assets and housing
There is no clean answer. The market knows this. The Bitfinex team warned: “A hot PPI number followed by a hawkish FOMC would be the most damaging combination for equities and risk assets.”
Core PCE — the Fed’s preferred inflation gauge — is already at 2.8%, well above the 2% target. After today’s PPI print, it’s likely headed to 3.1%+. The dot plot has to acknowledge this.
FOMC at 2 PM ET: What the Dot Plot Means
| Scenario | Dot Plot | Probability | BTC Impact |
|---|---|---|---|
| Hawkish | 0 cuts in 2026 | ~30% (rising after PPI) | Drop to $68K–$70K |
| Neutral | 1 cut maintained | ~50% (base case) | Sell-the-news to $70K–$72K |
| Dovish | 2 cuts signaled | ~20% (unlikely after PPI) | Rally to $76K–$80K |
The PPI data shifted the probability distribution. Before this morning, the neutral and dovish scenarios were roughly equal. Now, the hawkish scenario has gained ground. JPMorgan already revised its 2026 forecast to zero cuts. Goldman sees the first cut no earlier than September.
Powell’s language on oil matters more than the dot plot today. If he calls the Iran-driven oil spike “transitory” (the T-word), markets rally. If he frames it as a “persistent supply shock,” risk assets sell off. Watch for the exact phrasing at 2:30 PM.
Trade the Post-FOMC Reaction
The next 6 hours will determine the direction for Q2. Binance offers the deepest liquidity for both spot and futures across 600+ pairs.
Sign up on Binance with 20% fee discount →
Use referral code RATE20 for a permanent 20% off all trading fees.
ETF Inflows: 7 Straight Days — Longest Since October
Amid all the noise, the institutional bid hasn’t flinched. U.S. spot Bitcoin ETFs posted $199.4 million in inflows on Tuesday — the seventh consecutive day, and the longest streak since October 2025.
| Day | Net Inflow | Key Fund |
|---|---|---|
| Mar 10 | +$167M | Streak begins |
| Mar 11 | +$251M | IBIT: $115M |
| Mar 12 | +$136M | Broad-based |
| Mar 13 | +$133M | BTC touches $74K |
| Mar 14 | +$180M | Strong close |
| Mar 17 | +$202M | Day 6 |
| Mar 18 | +$199M | Day 7 — IBIT: $169M |
| 7-Day Total | ~$1.27B | AUM: $96.7B |
BlackRock’s IBIT alone pulled $169 million on Tuesday — 85% of all inflows. When one firm controls the marginal bid with that kind of consistency, the selloffs have floors.
The counterpoint: short-term holders are cashing out. On-chain data shows STH profit-taking accelerating even as ETFs buy. The net effect has been range-bound consolidation around $72K–$75K. The FOMC dot plot decides which side breaks first.

The “Sell the News” Pattern: Will It Repeat?
This is the stat that bears keep citing: Bitcoin dropped after 7 of 8 FOMC meetings in 2025. In January 2026, it fell 7.3% in 48 hours despite a hold that was universally expected.
The Phemex research team notes that the post-FOMC price low typically forms approximately 48 hours after the statement — putting the potential trough in the March 19–20 window if the pattern repeats.
But the setup is different this time:
- January: Funding was positive (crowd was long). Liquidation risk was to the downside.
- March: Funding was negative for 14 days. $113M in shorts already liquidated Sunday. The crowd was short — many are now sidelined.
- January: No ETF inflow streak. No institutional momentum.
- March: 7-day ETF streak with $1.27B in cumulative inflows.
The sell-the-news pattern requires sellers. If the shorts are already liquidated and the ETFs keep buying, who’s left to sell? That’s the asymmetry the bulls are betting on.
Technical Levels for Decision Day
| Level | Price | Significance |
|---|---|---|
| Strong Support | $68,000–$69,000 | Break below opens $65K |
| Key Support | $70,000 | Psychological floor |
| Current Price | $72,300 | Post-PPI pullback |
| Resistance | $74,000–$75,000 | Pre-PPI high |
| Strategy B/E | $75,696 | 761,068 BTC cost basis |
| 50-Day SMA | $76,862 | First major MA target |
| Breakout Target | $78K–$80K | If dovish dot plot |
A daily close above $75K on strong volume = first meaningful breakout since October 2025. A close below $70K = the sell-the-news pattern wins again and we retest the $65K–$68K range.
Minimize Your FOMC Day Trading Costs
FOMC days generate the highest single-day volumes of any recurring macro event. Fees add up fast. Minimize them:
Stack your discounts on Binance:
- 20% off — Use referral code RATE20 at signup
- 25% off — Pay fees with BNB token
- Maker discount — Use limit orders for even lower futures fees
Effective fee: as low as ~0.06% per trade.
Start trading on Binance with maximum discount →
For the complete guide to maximizing savings, see Get 20% off with code RATE20.
The Next 6 Hours
| Time (ET) | Event | What to Watch |
|---|---|---|
| Now | Pre-FOMC positioning | BTC consolidating at $72.3K |
| 2:00 PM | Rate decision + dot plot + SEP | Dot plot shift: 0, 1, or 2 cuts |
| 2:30 PM | Powell press conference | Oil language: “transitory” vs “persistent” |
| 3:00–4:00 PM | Initial reaction settles | First move is often reversed |
| Mar 19–20 | Post-FOMC trough window | Historical pattern: 48h low |
The PPI just made Powell’s job impossible. Growth is collapsing (0.7% GDP). Inflation is accelerating (PPI double expectations). Oil is $100+ and rising. The war hasn’t peaked. And 761,068 BTC worth of Strategy’s capital is sitting 4.5% below break-even, waiting for one sentence from a Fed chair who’s leaving in two months.
Whatever happens at 2 PM, it won’t be boring.
What was the February 2026 PPI reading?
February 2026 PPI rose 0.7% month-over-month, more than double the 0.3% consensus forecast. Core PPI came in at 0.5% versus 0.3% expected. This data was collected before the Iran oil shock and 15% tariffs impacted prices, meaning March’s PPI will likely be even higher. The hot print complicates the Fed’s rate cut path and triggered a $2,000 Bitcoin selloff.
What time is the FOMC decision on March 18, 2026?
The FOMC rate decision and dot plot are released at 2:00 PM ET on March 18, 2026, followed by Chair Jerome Powell’s press conference at 2:30 PM ET. The Fed is widely expected to hold rates at 3.50–3.75%. The dot plot — projecting zero, one, or two rate cuts for 2026 — is the key market mover.
What is the best Binance referral code?
The best Binance referral code is RATE20, giving you a permanent 20% discount on all trading fees. Combined with BNB fee payment (25% off), your effective fee drops to ~0.06% per trade.
Create your Binance account with 20% fee discount →
Referral code: RATE20 — permanent 20% off all trading fees.
This article is for informational purposes only and does not constitute financial advice. Always do your own research before making investment decisions.
Verify Before You Sign Up — Don't Get Scammed
Many sites advertise fake referral discounts that don't actually apply. Before signing up through any referral link, always verify the referral code and discount rate shown on the Binance registration page. Here's proof of our verified referral:

- Referral Code: RATE20
- Trade Rebate: Up to 20% on every trade (lifetime)
- New User Bonus: Up to 19,800 USD
If the registration page does not show these benefits, do not proceed. Only sign up when you can confirm the referral code and discount are applied.
Related Articles

Keep the Session Going With Stronger Hubs
Daily Crypto Market News
A fresher archive of daily market briefs, macro setups, and Bitcoin-led updates.
Bitcoin ETF Flows Guide
Understand what inflows and outflows actually mean, with recent examples and links.
Binance Fee Calculator
High-intent tool content that converts well and answers a clear search query.
Verified Binance Referral Guide
The core evergreen page for your highest-value signup intent.