Bitcoin Is Up 44% in Q3. Why $87.4K Still Matters — Sept. 27
Bitcoin is up 44% in Q3 but remains below $87.4K. Explore the resistance levels, slowing ETF inflows, and mixed signals from major altcoins.
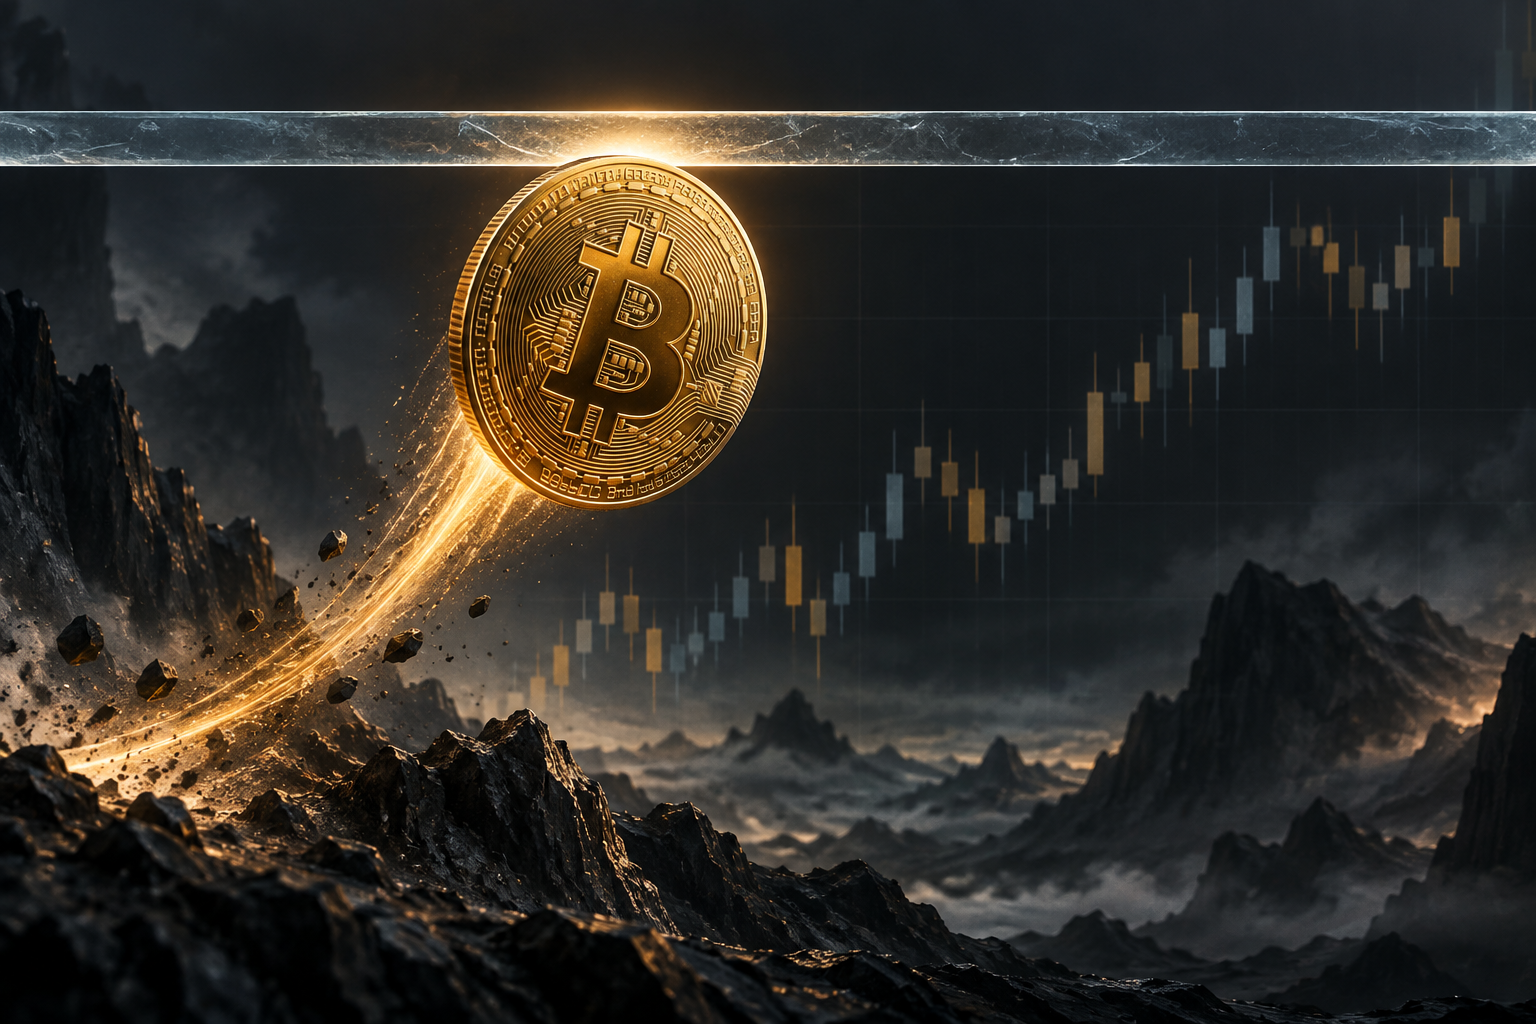
Bitcoin has gained 44.2% this quarter—and it is still $2,875 below the level that would end the argument. BTC/USDT traded at $84,521 on September 27, positive over the latest 24 hours but 3.3% beneath its September 21 peak. Five straight ETF inflow sessions say institutions are buying; shrinking daily inflows and weaker market breadth say the easy part of the rally may already be over.
Is Bitcoin still bullish at $84,521?
Yes, Bitcoin’s quarterly trend is bullish, but the short-term breakout remains unconfirmed below $87,396. The Binance BTC/USDT market showed $84,521.12 at the research cutoff of 2026-09-27 07:00 UTC, up 0.73% across the rolling 24-hour window from 07:00 UTC on September 26.
Zoom out and the move is difficult to dismiss. BTC/USDT opened July 1 at $58,624.71 and reached a quarter-to-date high of $87,395.67. At the cutoff, that left Bitcoin up 44.2% for Q3 even after retreating from the high.
| Bitcoin measure | September 27 snapshot | What it says |
|---|---|---|
| BTC/USDT | $84,521.12 | Buyers still control the quarterly trend |
| Rolling 24-hour change | +0.73% | Quietly positive weekend trade |
| Rolling 24-hour range | $83,838–$84,654 | Compression beneath first resistance |
| Q3 return from July 1 open | +44.2% | The larger advance remains intact |
| Q3 high | $87,395.67 | The breakout level bulls have not reclaimed |
| Distance below Q3 high | -3.3% | Close enough to challenge, far enough to fail again |
This is not the same setup as buying the July low. The market has already repriced aggressively, sentiment is greedy, and resistance is visible. Momentum is an advantage; paying any price for momentum is a hobby.
Five ETF inflow days hide one awkward detail
U.S. spot Bitcoin ETFs attracted $2.386 billion across the five completed sessions from September 21 through September 25. That is real demand. The awkward detail is that the daily total fell every session, according to Farside Investors.
| Session | Net spot Bitcoin ETF flow | Change from prior session |
|---|---|---|
| September 21 | +$999.0M | — |
| September 22 | +$714.7M | -28.5% |
| September 23 | +$346.9M | -51.5% |
| September 24 | +$190.7M | -45.0% |
| September 25 | +$134.5M | -29.5% |
| Five-session total | +$2,385.8M | Positive, but decelerating |

The final session was 86.5% smaller than the first. That does not turn the streak bearish: five green days still removed a meaningful supply burden from the market. It does change the question from “Are funds buying?” to “Can buying remain strong enough to force a breakout?”
The concentration matters too. On September 25, IBIT added $97.0 million and FBTC added $49.3 million, while BITB lost $11.8 million and the remaining funds printed zero. Positive flow carried by two products is useful, but it is less convincing than demand broadening across the complex.
ETF flow data arrives after the U.S. session and can be revised. It is better used as confirmation than as a minute-by-minute trading signal. Price leads; flows tell you whether institutional plumbing is helping.
Trade the level, not the quarterly headline
A 44% quarter attracts attention after the move has happened. If you trade the setup, define the invalidation level first and confirm product availability in your jurisdiction.
Sign up on Binance with 20% fee discount →
The signup link pre-applies RATE20 for a 20% trading-fee discount. You do not need to copy or type the code. Review the referral details on Binance before completing registration.
Which Bitcoin levels matter now?
Bitcoin needs to hold the $83,000–$83,800 area and close above $85,255 before a clean test of $87,396 becomes likely. Those levels come from completed and current Binance BTC/USDT daily candles, not a line drawn wherever the chart looks cooperative.
| BTC level | Role | Confirmation or warning |
|---|---|---|
| $82,875–$83,183 | Major near-term support | September 24–25 lows; losing it weakens the range |
| $83,798–$83,838 | Immediate support | Latest daily and rolling 24-hour lows |
| $84,942–$85,255 | First resistance | September 24–25 highs cap the current recovery |
| $87,279–$87,396 | Breakout ceiling | Two recent highs define the quarter’s barrier |
| $80,850–$81,178 | Deeper support | Base of the September 21 impulse move |
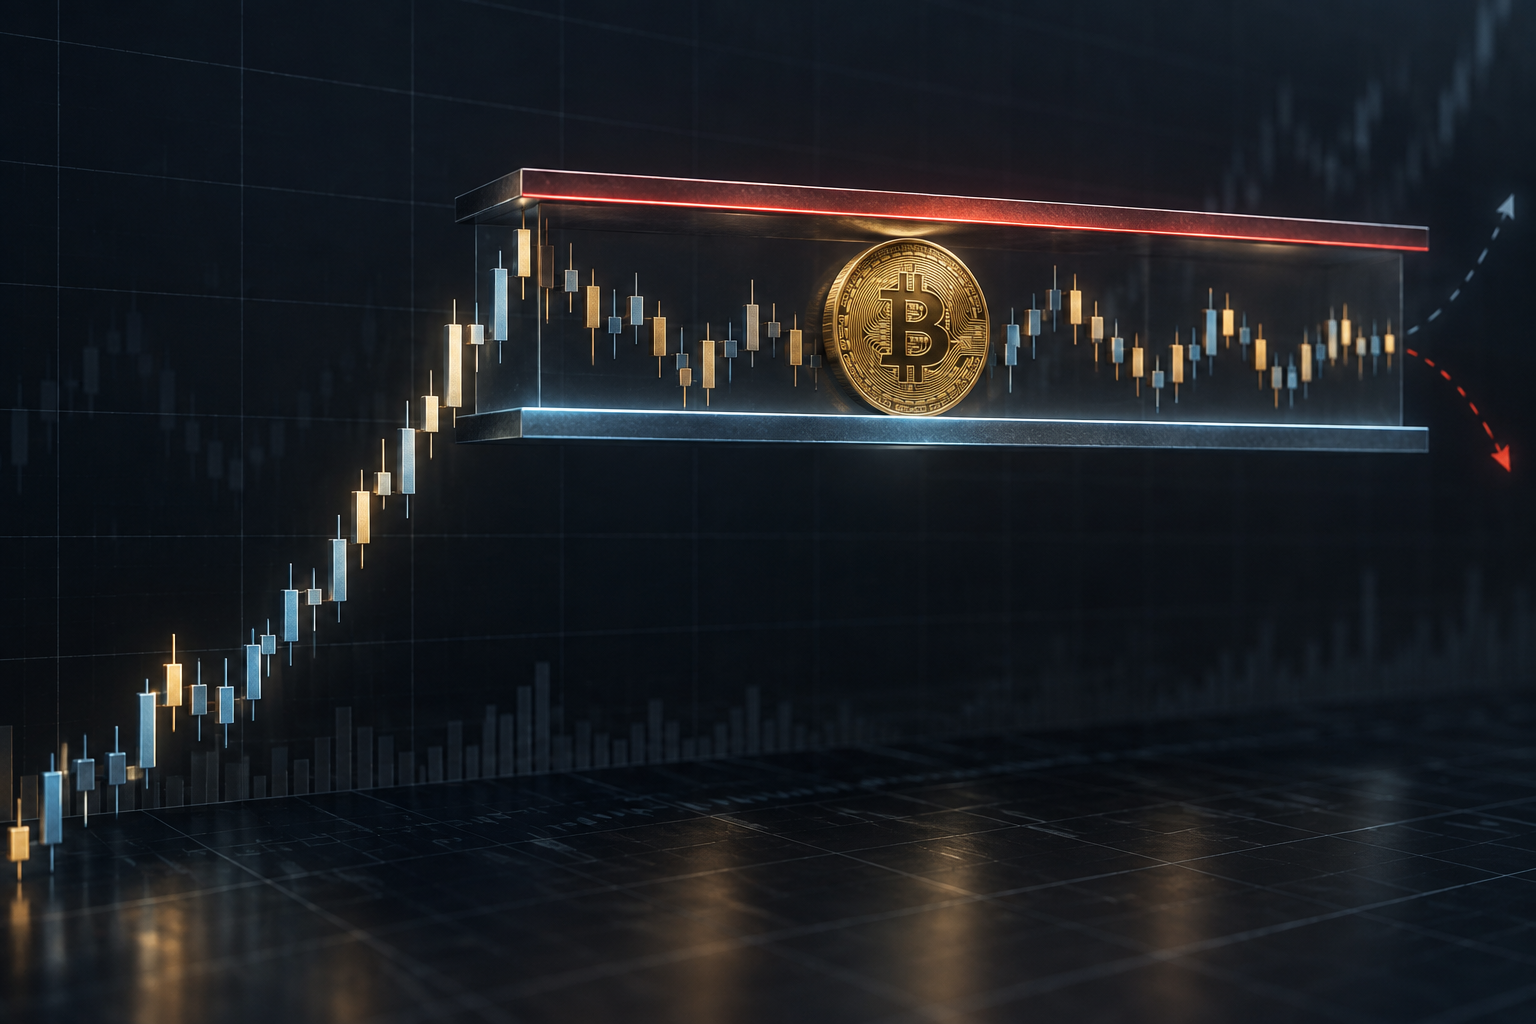
The bullish sequence is simple: defend $83,800, accept above $85,255, then close through $87,396 with expanding volume. A wick above the high followed by a close back inside the range would be a liquidity sweep, not proof of escape.
The bearish sequence starts with repeated failure near $85,000 and a daily close below $82,875. That would expose the $80,850–$81,178 launch zone. Losing that base would not erase a 44% quarter, but it would turn the latest breakout into a failed one—and failed breakouts tend to move quickly because everyone discovers the same exit at once.
Why the broader crypto market is not confirming yet
Large-cap performance was mixed even as Bitcoin held firm. The Binance markets overview showed ETH and SOL modestly outperforming BTC over the same rolling window, while XRP fell 1.71%.
| Binance pair | Price at cutoff | Rolling 24-hour change | Rolling 24-hour range |
|---|---|---|---|
| BTC/USDT | $84,521.12 | +0.73% | $83,838–$84,654 |
| ETH/USDT | $2,708.15 | +0.82% | $2,664.79–$2,712.13 |
| SOL/USDT | $121.40 | +1.00% | $119.82–$122.10 |
| BNB/USDT | $774.88 | +0.34% | $766.82–$776.19 |
| XRP/USDT | $1.5222 | -1.71% | $1.5015–$1.5570 |
CoinGecko’s market-data snapshot put total crypto capitalization at $2.908 trillion, down 2.02% over 24 hours, with Bitcoin dominance at 58.26%. Because exchanges and aggregators use different asset universes, pricing sources, and update clocks, that aggregate move should not be compared mechanically with one Binance pair. The useful signal is direction: the global market chart did not show the same clean strength as BTC, ETH, and SOL.
Ethereum is the quarter’s notable counterpoint. ETH/USDT rose 72.3% from its July 1 open to the cutoff, comfortably beating Bitcoin. Yet Bitcoin dominance above 58% says capital is still concentrated. This looks like selective risk-taking, not an indiscriminate altcoin bid.
Sentiment adds another yellow flag. The Crypto Fear & Greed Index was 70, or “Greed,” down from 74 a day earlier. Greed is not a sell signal; bull markets can stay greedy for weeks. It does mean the market has less emotional slack if $87,400 rejects again.
Stack your Binance fee discounts
Range trading can make correct analysis expensive. Stack your discounts on Binance where the current terms and your jurisdiction allow:
- 20% off — Open the signup link with RATE20 already applied
- 25% off — Pay eligible spot fees with BNB token
- Maker discount — Use limit orders where maker pricing is lower
| Example trading volume | Fee at 0.10% | After a 20% referral reduction | Example savings |
|---|---|---|---|
| $10,000 | $10.00 | $8.00 | $2.00 |
| $100,000 | $100.00 | $80.00 | $20.00 |
| $1,000,000 | $1,000.00 | $800.00 | $200.00 |
Effective fees can be as low as ~0.06% per trade when eligible discounts stack. Actual fees depend on product, VIP tier, order type, BNB settings, region, and the offer Binance displays to you.
Open Binance signup with RATE20 →
For the signup checklist and current terms, get 20% off with code RATE20.
What would confirm Bitcoin’s next move?
The next directional move needs agreement between price, participation, and flows. A breakout with only one of the three is vulnerable to reversal.
Watch for:
- A daily close above $85,255, followed by acceptance above $87,396.
- Spot volume expanding as price attacks the quarter high.
- ETF inflows remaining positive without shrinking for another session.
- Total crypto market capitalization and large-cap breadth turning higher together.
- Bitcoin holding $82,875 if the first breakout attempt fails.
The contrarian point is that the 44% quarterly gain is not the bullish argument anymore; everybody can see it. The argument now is whether fresh demand can absorb profit-taking near $87,400. Five ETF inflow days make that plausible. Their steady deceleration keeps it unproven.
Frequently asked questions
Will Bitcoin break $87,400?
Bitcoin can break $87,400, but the move is not confirmed until price closes above $87,395.67 and holds the level. Immediate resistance sits at $84,942–$85,255. A rejection followed by a close below $82,875 would favor more consolidation first.
Is Bitcoin overbought after gaining 44% in Q3?
A 44.2% quarterly gain shows strong momentum, not an automatic sell signal. However, a Fear & Greed reading of 70, fading ETF inflow intensity, and mixed market breadth raise the cost of chasing. Risk should be defined against support rather than against a bullish narrative.
Do positive ETF inflows guarantee a Bitcoin breakout?
No. ETF inflows show demand through one channel, but they do not measure all selling pressure. The five-session inflow streak has slowed, and Bitcoin remains below $87,396. Watch price acceptance and trading volume alongside the flow data.
Create your Binance account with 20% fee discount →
Referral code: RATE20 — 20% trading-fee discount, pre-applied by the signup link. Review the displayed terms before registration. SmallDrift may earn a commission when you sign up through this link.
This article is for informational purposes only and does not constitute financial advice. Always do your own research before making investment decisions.
Research cutoff: 2026-09-27 07:00 UTC. Binance figures use rolling 24-hour windows ending at the cutoff; Q3 returns use July 1 UTC opens and the partial September 27 candle. ETF figures use the latest completed U.S. session, September 25. Linked market pages show current data and will differ from this historical snapshot.
Get 20% Off Binance Trading Fees with RATE20
New to Binance? Open the official signup page with RATE20 already applied for a 20% trading-fee discount. You do not need to copy or type the code. Review the referral details before completing registration.

- Referral code: RATE20, pre-applied by this link
- Fee discount: 20%, shown on the Binance signup screen
- Additional rewards: Check Binance for current promotions and regional availability
Be wary of unofficial referral offers promising benefits they cannot show. The Binance signup screen lets you check the code and fee discount directly.
Compare Binance fees and available discounts →
SmallDrift may earn a commission when you sign up through this link. Trading involves risk, including loss of capital.
Related Articles


Explore Related Guides
Daily Crypto Market News
Follow Bitcoin price moves, major altcoins, and the events shaping the market.
Bitcoin ETF Flows Guide
Understand ETF inflows and outflows, and how to read them alongside price action.
Binance Fee Calculator
Learn how to estimate trading costs with referral and BNB discounts.
Verified Binance Referral Guide
See how RATE20 is applied and what to check on the Binance signup screen.