Bitcoin Fell 1.16%: Why $77.8K Matters — Sep. 10, 2026
Bitcoin slipped to $78.4K as ETF outflows and pre-CPI caution hit crypto. Here are the confirmation and failure signals that matter now.

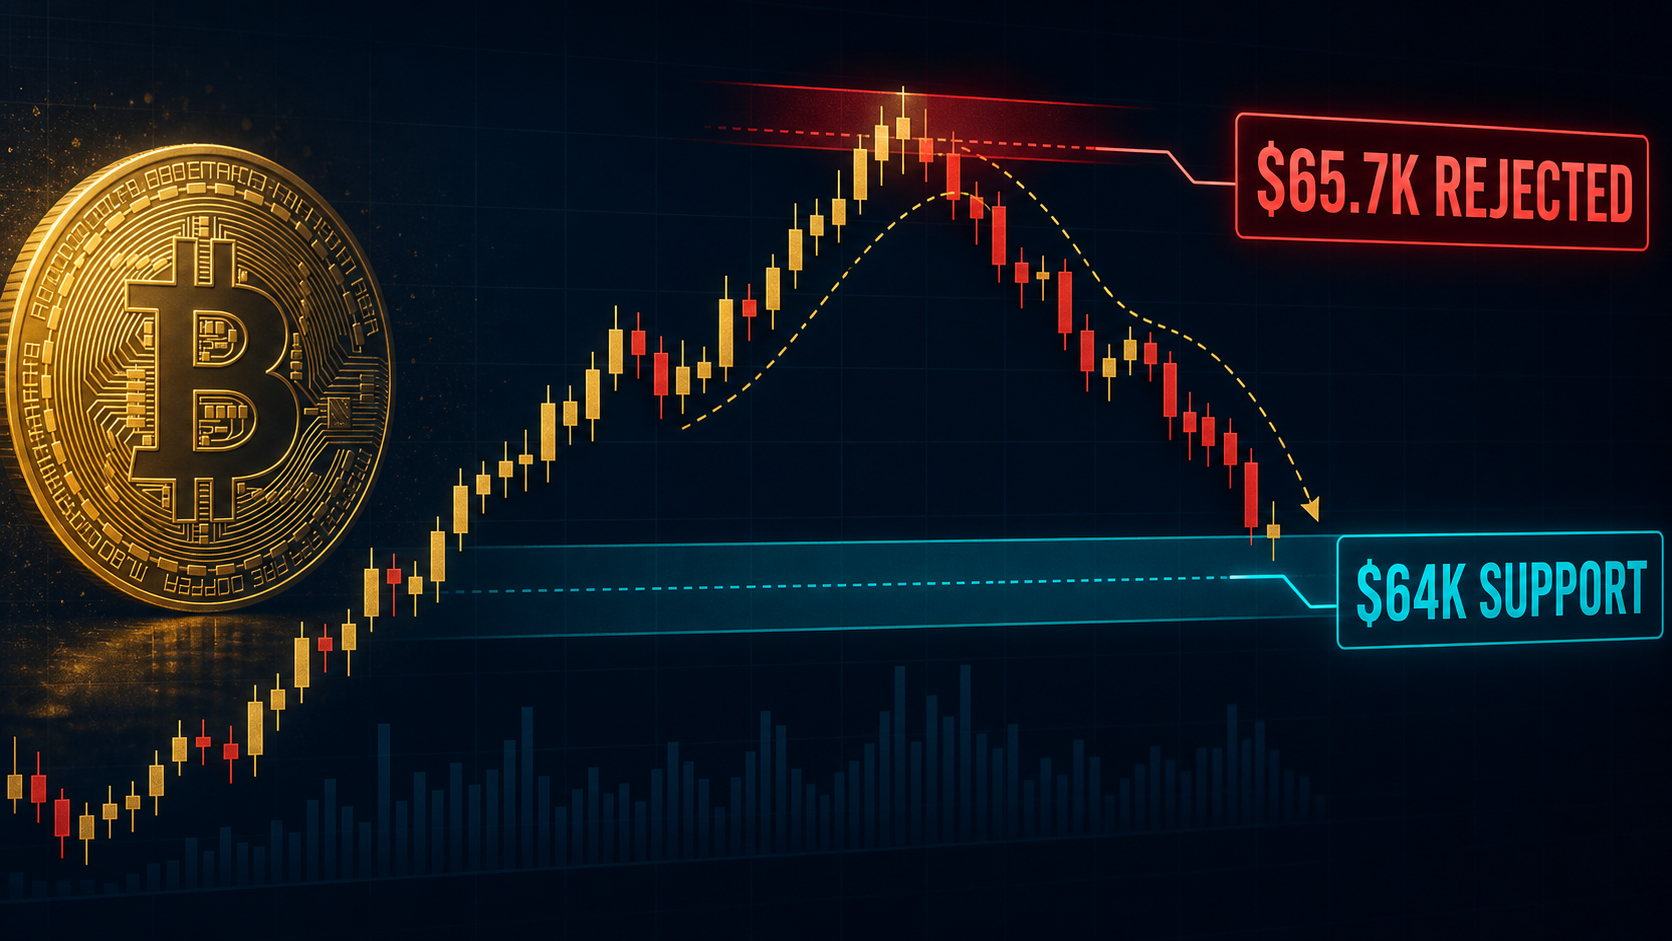
Bitcoin fell 1.16% to $78,385, while the rest of the liquid crypto complex fell harder. The obvious explanation is nerves before the next U.S. inflation report; the less comfortable one is that buyers have not yet proved they can defend the rebound while ETF demand cools. If you are watching for a durable turn rather than renting someone else’s conviction, the $77,770 rolling low now matters more than another dramatic prediction.
Is Bitcoin’s decline a breakdown?
Not yet. Bitcoin is testing the lower half of its latest range, but it has not broken the rolling 24-hour low. At 05:18 UTC on September 10, the Binance 24-hour ticker snapshot placed BTC/USDT at $78,385.18, down 1.158%, after trading between $77,770 and $79,760. Quote turnover was about $1.09 billion across 3.32 million trades.
That is a real retreat in a deep market, not a stray print. It is also a bounded one. A market becomes more interesting when it forces a decision, and this range has supplied two: can sellers push through $77.8K, and can buyers reclaim the midpoint before challenging $79.8K again?
| September 10 Binance snapshot | Reading | What it says |
|---|---|---|
| BTC/USDT last price | $78,385.18 | Below the rolling open and midpoint |
| 24-hour change | -1.158% | Sellers control the latest window |
| 24-hour high | $79,760.00 | First clear recovery boundary |
| 24-hour low | $77,770.00 | Immediate failure boundary |
| Quote turnover | $1.09B | The move occurred in a liquid spot pair |
The midpoint of that range is $78,765. Holding back above it would be the first modest improvement. Reclaiming $79,760 and then surviving a retest would be stronger evidence of renewed acceptance. A decisive loss of $77,770 would instead turn a routine pullback into a fresh lower-low problem. Technical analysis does not predict the future; at its best, it stops you from pretending every outcome is the same.
Why is the CPI clock tightening the range?
The next scheduled macro catalyst is less than two days away, so short-term positioning can overwhelm crypto-specific narratives. The official U.S. Bureau of Labor Statistics release calendar schedules the August Consumer Price Index for September 11 at 8:30 a.m. Eastern Time.
That timing matters because inflation can reset expectations for interest rates, Treasury yields, the dollar, and risk assets in one burst. Bitcoin trades continuously, while the macro data arrive at a fixed moment. The mismatch encourages traders to reduce leverage or wait for confirmation before the release.
It does not tell you which direction Bitcoin will move. A softer-than-expected number could help risk appetite, but only if markets interpret it as benign disinflation rather than weakening demand. A hotter print could lift yields and pressure crypto, but positioning can produce the opposite first reaction. The macro calendar is a volatility warning, not a fortune cookie.
| Condition around CPI | Constructive signal | Caution signal |
|---|---|---|
| Before the release | BTC holds $77,770 with calmer turnover | Repeated tests weaken the range floor |
| Initial reaction | Price reclaims $78,765 and holds | Fast whipsaw through both sides of the range |
| Follow-through | $79,760 becomes support on a retest | $77,770 breaks and cannot be reclaimed |
| Market breadth | Liquid majors stabilize with BTC | Altcoins keep falling faster than BTC |
The useful move is to define those conditions before the number lands. Deciding afterward, during a vertical candle and a widening spread, is less analysis than improv theatre.
What do two ETF outflow days actually mean?
They weaken the immediate demand signal, but they do not erase September’s earlier inflows. Farside Investors’ U.S. spot-Bitcoin ETF table recorded a $120.2 million net outflow on September 9 after a $46.6 million outflow on September 8. September 3 alone brought in $730.8 million, and the six displayed September sessions through September 9 still sum to roughly $603.2 million of net inflows.
This is the distinction the daily headline usually buries. Two negative sessions matter because marginal institutional demand cooled just as price slipped below $79K. Yet the month-to-date ledger remains positive. Calling that either “institutions are gone” or “ETFs will save the dip” requires more confidence than the evidence provides.
The fund-level detail is also uneven. On September 9, Farside showed $78.0 million leaving ARKB and $27.2 million leaving GBTC, partly offset by $4.5 million entering MSBT; several other funds were flat or not yet showing flows. Aggregate numbers are useful, but they are the sum of different allocators making different decisions.

Trade the CPI setup with conditions
The market is offering a range and a scheduled catalyst, not a guarantee. Set your confirmation, invalidation, position size, and maximum loss before the release; if the first move is chaotic, doing nothing is still a position.
Check the current Binance signup offer with code RATE20 →
Use referral code RATE20 during eligible new-account signup. Confirm the code and current offer shown by Binance before completing registration.
Are whales quietly buying this dip?
The public evidence used here cannot support that claim, and wallet-size folklore should not be mistaken for entity-level proof. The current Glassnode holder-supply dataset, last displayed for September 6, split circulating supply into 64.335% long-term-holder profit, 23.538% long-term-holder loss, 11.621% short-term-holder profit, and 0.505% short-term-holder loss.
Those figures say something useful about holder age and unrealized profitability. They do not identify a “whale buy” in the latest session. In fact, 87.873% of supply in the displayed breakdown belonged to long-term-holder cohorts, but roughly 26.8% of that long-term-holder supply was in loss. Older ownership can reduce immediately mobile supply; it can also create overhead selling when underwater holders get an exit.
| Glassnode cohort snapshot | Share of supply | Limitation |
|---|---|---|
| Long-term holders in profit | 64.335% | Profit does not mean intent to sell |
| Long-term holders in loss | 23.538% | Loss does not mean capitulation |
| Short-term holders in profit | 11.621% | Cohort age is not wallet size |
| Short-term holders in loss | 0.505% | Snapshot predates today’s live price |
So the honest answer is conditional: watch exchange flows and entity-adjusted accumulation data as they update, but do not retrofit a whale story onto every dip. Sometimes a red candle is just a red candle wearing an expensive newsletter.
Which liquid altcoins are confirming the risk-off move?
All four liquid Binance majors in this watch set were negative, and three underperformed Bitcoin. ETH declined almost in line with BTC, while SOL, XRP, and BNB fell more sharply. That is narrowing breadth, not hidden strength.
| Binance pair | Last price | 24-hour move | Quote turnover | Read-through |
|---|---|---|---|---|
| ETH/USDT | $2,478.65 | -1.165% | $733.8M | Closest to BTC’s decline; core breadth gauge |
| SOL/USDT | $101.95 | -2.524% | $221.5M | Higher-beta pressure, but deep participation |
| XRP/USDT | $1.3893 | -3.137% | $199.4M | Clear underperformance versus BTC |
| BNB/USDT | $722.21 | -4.261% | $134.0M | Weakest percentage move in the set |
Liquidity is why these four belong on the watchlist. Their turnover makes relative strength more informative than a spectacular move in a thin pair. Confirmation would mean they stop losing ground to BTC while turnover remains healthy; invalidation would mean leadership narrows further and rebounds arrive on fading participation.

A Binance-specific liquidity warning
The exchange’s latest operational notice reinforces that pair liquidity deserves attention. Binance said in its September 11 spot-pair removal notice that it will cease trading OPEN/FDUSD, SAGA/FDUSD, and VELODROME/USDC at 03:00 UTC, citing periodic reviews that can consider poor liquidity and volume. Binance also clarified that removing these pairs does not remove the underlying tokens from spot trading where other pairs remain available.
None of those removals applies to ETH, SOL, XRP, or BNB in the table. The broader lesson is the point: “listed on Binance” and “liquid in the pair you plan to trade” are not interchangeable statements. Check the exact market, not merely the ticker symbol.
What matters next for Bitcoin?
The cleanest near-term answer is acceptance above $79,760 or failure below $77,770; everything between is unresolved range trade. ETF flows and CPI can explain pressure, but price confirmation should decide whether that pressure has produced a break.
- A move back above $78,765 would recover the range midpoint, a first repair rather than a breakout.
- A hold above $79,760 after a retest would show buyers accepting the upper boundary.
- A break below $77,770 followed by a failed reclaim would confirm deterioration.
- Stabilizing ETH, SOL, XRP, and BNB relative to BTC would make any rebound broader and more credible.
Notice what is absent: a price target. Targets create false precision when the market is waiting for scheduled information. Boundaries and invalidations are less glamorous, which is precisely why they are useful.
FAQ
Is $77,770 Bitcoin support today?
It is the latest Binance 24-hour low and therefore the immediate support reference, not a guaranteed floor. A decisive break followed by a failed reclaim would weaken the setup; the snapshot was taken at 05:18 UTC on September 10 and changes continuously.
Are Bitcoin ETF flows negative in September?
No. The two latest completed sessions were negative, but the six September sessions displayed through September 9 sum to about $603.2 million of net inflows. Flow tables can update, and daily ETF data should be compared with live price on the correct timestamp.
Which altcoins best show whether breadth is improving?
ETH, SOL, XRP, and BNB are useful current gauges because their Binance USDT pairs each showed more than $130 million of rolling quote turnover. That makes them liquid comparison instruments, not recommendations, and their prices and volumes remain volatile.
Save on fees before you trade
Before you trade, compare the current referral offer with the applicable fee schedule, product, order type, and BNB fee setting. Each can change the effective cost.
Use the SmallDrift fee calculator before you trade →
For the code, signup checks, and affiliate disclosure, see the Binance referral-code guide and Binance referral code and signup checks.
Open the official Binance signup page with code RATE20 →
Referral code: RATE20. Verify the code and the current eligible offer on Binance before finishing signup.
This article is for informational purposes only and does not constitute financial advice. Always do your own research before making investment decisions.
Market-data note: Prices, volumes, and percentage changes are snapshots from the research time stated in this article, not live quotes. Linked market pages show current data and may differ from these historical figures.
Get 20% Off Binance Trading Fees with RATE20
New to Binance? Open the official signup page with RATE20 already applied for a 20% trading-fee discount. You do not need to copy or type the code. Review the referral details before completing registration.

- Referral code: RATE20, pre-applied by this link
- Fee discount: 20%, shown on the Binance signup screen
- Additional rewards: Check Binance for current promotions and regional availability
Be wary of unofficial referral offers promising benefits they cannot show. The Binance signup screen lets you check the code and fee discount directly.
Compare Binance fees and available discounts →
SmallDrift may earn a commission when you sign up through this link. Trading involves risk, including loss of capital.
Related Articles


Explore Related Guides
Daily Crypto Market News
Follow Bitcoin price moves, major altcoins, and the events shaping the market.
Bitcoin ETF Flows Guide
Understand ETF inflows and outflows, and how to read them alongside price action.
Binance Fee Calculator
Learn how to estimate trading costs with referral and BNB discounts.
Verified Binance Referral Guide
See how RATE20 is applied and what to check on the Binance signup screen.